Long: AAOI
AAOI makes the laser every module maker is short of, and its shares are priced as if it bought them.
Disclosure: I am long AAOI. I may add to or reduce the position without notice and without updating this piece. This is analysis, not investment advice.
The recommendation
Applied Optoelectronics, Inc. (NASDAQ: AAOI). Long.
| Price | $122.19 | the August 19, 2026 close (the daily series) |
| Value | $250 | +104%, on a module margin the company’s own laser holds up, a capacity ladder that fills on its own record, and a laser business the fab adds from late 2027 |
$10.3 billion market cap on 84.6 million shares outstanding, or $13.0 billion on the 106.1 million shares the valuation uses with the convertible notes, the Amazon warrant, the awards and the equity the build still needs counted. The model is attached — every figure in section 3 comes out of it.
Key points. This note rests on three claims; the third depends on the first, and the second stands on its own.
Thesis 1: AAOI’s module margin has a floor under it that the laser gives it, so when the shortage ends its margin does not fall with the module price. Every high-speed transceiver has one component whose price is rising, the indium-phosphide laser, and most module makers buy it from sellers who are allocating what they can make. AAOI grows and fabricates its own in Sugar Land, Texas, and carries it at cost. In the shortage that shows as a lower printed margin than the makers that buy their lasers, because its largest account is priced under a capped formula in a ten-year reservation contract and its new lines are starting up. When the shortage ends and module prices resume their decline, the part that would have to be bought at a rising price never is, and the margin settles near the level the scaled makers earned before the shortage.
Thesis 2: AAOI will ship about six million 800G and 1.6T modules in 2027 and nine million in 2028, filling its published capacity about two-thirds and three-quarters. The company has said what it is installing, month by month, and when: 650,000 modules a month by the end of 2026 and 930,000 by the end of 2027. Its book is sold out through the second half of 2027 with customers pressing it to ship sooner. What sets the fill below the nameplate is the company’s own conversion record so far, the customers’ qualification clocks and the signal-processor chips it has to buy, all of which are real and all of which the estimates in section 3 already carry.
Thesis 3: AAOI’s laser fab becomes a second product line from late 2027, selling lasers and external laser sources into a market its competitors say is short. The next packaging step moves the optical engine into the switch package, and the part that survives that move is the laser source outside it. Of the three Western makers that fabricate the laser, one says it will not sell it outside its own modules, and the one that sells most of its output to other makers says demand is outpacing its supply and it is allocating. AAOI is tripling its fab and building a second one, and today turns away that business because its own modules need every laser it makes. Thesis 3 depends on thesis 1: it is the same fab and the same shortage.
The first test has a date on it. The third-quarter results, due in the first week of November on the company’s pattern, carry three readings: whether the fourth-quarter guide still says “more than $500 million,” whether the second hyperscaler’s 1.6T qualification has closed, and whether management restates the internal share of the company’s lasers, which it has never filed beyond “the majority.” The fourth quarter itself is reported in February.
1. Company overview
Applied Optoelectronics makes optical transceivers, the plug-in modules at each end of a fiber link inside a data center. A module takes the electrical signal from a switch or a server’s network card, drives a laser to put it onto the fiber, and turns the light coming back into an electrical signal. Every high-speed module is built from four families of parts a maker either builds or buys: the optical chips, the laser and the photodetector; the electrical chips, the digital signal processor, the driver and the amplifier that condition the signal; the passive optics that couple them; and the board and the housing. The chips are more than half of the material cost on the makers’ own filings. AAOI fabricates the laser and builds the light engine around it, and in some products the driver and amplifier electronics too; the digital signal processors and the transimpedance amplifiers for 800G and 1.6T it buys, from suppliers at which it is “the fourth priority” (the Q2 call). “All of our laser chips are manufactured in our facility in Sugar Land, Texas,” grown by two epitaxy processes it calls “unique in our industry,” and “the majority of the data center optical transceivers that we sell utilize our own lasers and subassemblies” (the FY2025 10-K, Item 1). The product line runs from 100G modules for the buyers’ installed fabrics through 400G to the 800G modules connecting this year’s AI clusters and the 1.6T modules the next generation attaches at, the two built on the same automated lines. Its second business is cable: the 1.8 GHz amplifiers and nodes U.S. cable operators are installing to raise their plant to the DOCSIS 4.0 standard, sold through a distributor. Revenue is booked where the product is made, and that is the plainest statement of the footprint: of the second quarter’s $191.9 million, $108.4 million was made in Taiwan, $82.2 million in China and $1.3 million in the United States (the Q2 2026 10-Q, Note 17). A Texas laser fab feeds Asian assembly plants and one 800G line at headquarters; the Texas transceiver factories at volume are what this year’s capital program builds.
The customers are three hyperscale operators and one cable operator, and two of the four have filed contracts. The top three customers were 42%, 26% and 24% of the second quarter and the top ten were 99% (the 10-Q, Note 10). The 42% is Digicomm, the cable distributor through which the amplifiers reach the largest cable customer, Charter by every public indication: Charter certified the Quantum18 amplifiers for deployment in July 2025 with Digicomm named as the fulfillment layer (the release). The other two are data-center customers. Microsoft, “our key customer in the internet data center market” at 28.8% of 2025 revenue (the 10-K), holds two statements of work filed as exhibits: under the first, effective December 2022, AAOI “will manufacture certain lasers in accordance with Microsoft’s specifications” — the 8-K’s own description; the exhibit carries a royalty back to Microsoft and a right of first refusal, their terms redacted; under the second, effective June 2023, Microsoft’s design-services payments were made “in consideration of a 10-year irrevocable reservation of the Dedicated Lines,” production lines “dedicated to production of Goods for Microsoft” sized to “the minimum capacity needed to fulfill Microsoft’s Forecasts,” at a price per unit that “includes no more than” three components, each redacted. Neither carries a purchase minimum; the second runs five years with annual renewals, and either party may end it on a year’s notice. Amazon holds a warrant on 7,945,399 shares at $23.70, of which 1.3 million vested at signing and 6.6 million vest as its payments for the company’s products accumulate toward $4 billion over ten years; nothing in the agreement obliges Amazon to buy. A third hyperscaler placed the company’s first volume 1.6T order, more than $200 million, and two 800G orders in the first quarter, and is expected back as a ten-per-cent customer in the third; the company has not named it. AAOI’s own May release describes itself as the primary vendor for Mediacom’s upgrade of its legacy Gainmaker and Motorola amplifier plant (the release).
AAOI is paid by purchase order, at shipment, and files neither units nor prices. “We do not have any long-term purchase commitments (in excess of one year) with any of our customers, most of whom purchase our products on a purchase order basis” (the 10-Q); prices are set at a product’s introduction and “thereafter through periodic negotiations with customers” (the 10-K). The exception is the form of the Microsoft book: a reservation of dedicated lines paid for in advance and a price capped by a formula whose three components are redacted, which is a foundry’s arrangement rather than a merchant’s, and section 2 says what that does to the margin. The cable amplifiers are sold to the distributor on “longer than typical payment terms … to ensure Digicomm has adequate inventory on hand,” which is why $211.0 million of the $314.0 million of receivables at June 30 belonged to one customer (the 10-Q). The company pays its own suppliers ahead: $324.0 million of prepayments for equipment sat on the balance sheet at June 30 against $50.9 million at year-end. What the price turns on is the volume the factories ship, the margin each module earns once the shortage ends, and how many shares the build is paid for with.
Capacity is being built on a published ladder. The company had “nearly 100,000 units per month of 800G and 1.6T capacity at the end of Q1,” was “approaching 200,000” at the end of June and “a little more than 200,000” in mid-August, and plans “over 650,000” a month by the end of 2026 with about 30% of that output from Texas, and “over 930,000” by the end of 2027 with over half from Texas (the Q1 call, the Q2 call, the Rosenblatt fireside of August 18). The clock for adding a line is the company’s own: “even in Asia it usually takes five to seven months. In the U.S., it adds another two months,” then “more than three months” to revenue (the Q1 call). The physical receipts are filed: a 209,665-square-foot Sugar Land building leased through 2036, “entirely dedicated to the manufacturing of 800G and 1.6T transceivers” (the Q2 call; the lease in the 10-Q, Note 4), a Houston building leased in February, two Pearland buildings of 388,133 square feet bought in April for $58.4 million, three more in Houston leased in May, and a $94.1 million design-build contract for 195,591 square feet of cleanroom at Pearland due in January 2027 (the 8-Ks). Capital spending was $335.1 million in the first half against $210.2 million in all of 2025, with a second half “at least as big,” and the chief financial officer puts the equipment’s payback at “9 months- 10 months ROI” (the fireside). The laser fab is being expanded “by almost 300% by Q3 next year,” and a second fab “about four times” the current one is planned in the Houston area (the Q2 call); the State of Texas awarded a $20.9 million grant against that expansion in April.
Revenue was $455.7 million in 2025, 54% of it cable, and the company’s guide for 2026 is “around $1.1 billion,” with a third quarter of $255 to 290 million and a fourth of “more than $500 million” (the Q2 release; the Q2 call); the lines by year are in the model attached.
2. The argument
Thesis 1: AAOI’s module margin has a floor under it that the laser gives it, so when the shortage ends its margin does not fall with the module price
The laser is the one part of a module whose price is rising, and the makers that sell it are allocating it. Lumentum’s annual report, filed two days before this note’s date, records in one filing the two goods moving in opposite directions: its laser chips showed “a slight increase in average selling prices … driven primarily by a shift to 200G lane speeds” while its own cloud transceivers grew “more than 173% … partially offset by lower average selling prices”; its components revenue, the laser chips and assemblies it sells to other makers, rose $889 million in the year, and “this demand is outpacing our current supply which has required us to make decisions on supply allocation” (the FY2026 10-K). On its May call its wafer fab capacity in Japan “remains at a premium and is fully allocated to meet surging customer demand” (the fiscal third-quarter call, May 5). Coherent’s chief executive, asked on the fiscal fourth-quarter call whether it would sell lasers to others: “I do not see any time in the near future where we would be selling Indium Phosphide lasers externally” (the call, August 12). The industry’s 2026 nameplate for the two laser types that matter is concentrated in a handful of makers (TrendForce, June 3), and the one that sells most of its output to the module makers at large is the one allocating it. The wafer beneath the laser is short too: a leading merchant substrate maker’s Chinese subsidiary has export permits for Europe and Japan and none for the United States, and it “cannot predict when a permit application will be reviewed and approved” (AXT’s 10-Q, August 13); Lumentum reserved six years of that maker’s substrate capacity with deposits (AXT’s 8-K, July 29).
AAOI does not buy the part. Three answers on the August 6 call say so. Asked about the industry’s bottlenecks, the chief executive put the bought signal-processor and amplifier chips first and then, “otherwise, laser is the biggest bottleneck right now for the transceiver business”; asked about adding laser capacity, that “from today, if I order the equipment,” it would take about two years “to start manufacturing high volume” (the transcript’s figure is 21 to 24 months, unaudited); asked about component priority, that the competitors’ “number one issue” is the laser, “and we don’t have this problem.” On the February call he put a figure on the internal share by year-end, more than 95%, as the third-party transcripts render it — the company files no transcript, and the machine renderings split “AI” and “AOI” elsewhere in the same call — which is also the company’s admission that some lasers were still bought in 2025. The fab’s economics never appear in the statements, by construction: intercompany balances and transactions are eliminated on consolidation (the 10-K). So the laser’s profit is inside the cost of goods, where a margin comparison cannot see it.
The largest account is priced under a cap, which is part of why the printed margin sits below the merchant makers’ in a shortage. The Microsoft statements of work fix the price per unit at “no more than” three components and reserve dedicated lines for ten years, sized to Microsoft’s forecasts (section 1). A price with a ceiling cannot carry a shortage premium, so the account that was 46.6% of revenue in 2024 and 28.8% in 2025 (the 10-K) contributed a cap rather than a level to the last two years’ margin, and its weight falls as the merchant accounts grow. What the three components are is redacted, so whether that price also holds when spot prices fall is not on the public record, and this note does not rest the floor on it: the floor is the laser.
The level the margin settles at is the one the scaled makers earned before the shortage, adjusted for what this company is. The two largest Chinese makers, which buy their lasers, earned product gross margins of 34.65% and 44.85% in 2024, before the shortage lifted them to 42.61% and 47.81% in 2025 (Innolight’s annual report; Eoptolink’s). A contract assembler that buys everything earns 12% (Fabrinet’s fiscal 2026). AAOI printed 27.7% in the second quarter (29.8% before stock compensation and the one-off items), a figure that carries the start-up of lines being commissioned inside the quarter, expedite fees and component costs the chief financial officer said “won’t be too much of a factor beyond Q4,” a 100G line shrinking on a customer’s memory shortage, and the capped book. Management dates a 40% non-GAAP margin to the end of 2027 (the fireside). This note’s path carries the data-center margin at 36% in 2027, 41% in 2028 and 2029 and 42% from 2030 in cash terms — two points below the scaled makers’ own pre-shortage arithmetic while the new lines start up and the shortage runs its clock, and at it once those have passed — and it does not carry the shortage margin the Chinese makers printed in 2025, because the shortage that lifts them is the same one that lifts this company and it is dated to end.
So a maker that fabricates the component whose price is rising, on automated lines it designed itself, does not fall to an assembler’s margin when module prices resume their decline, and its largest account is reserved for ten years under a capped price. The 10-K’s “majority” sentence and the two Microsoft exhibits settle the mechanism; what remains open is the product-level share of internal lasers today, which the company has never filed and which the November call is the first place to hear restated.
Thesis 2: AAOI will ship about six million 800G and 1.6T modules in 2027 and nine million in 2028, filling its published capacity about two-thirds and three-quarters
The demand is decided by the buyers’ fabrics, and the company’s ladder is a small share of it. NVIDIA’s reference architecture for its current rack lists 144 node-side, 144 leaf-side and 288 switch-to-switch transceivers for 144 GPUs, four modules per GPU, the same ratio at every scale the table gives (the reference architecture, Table 6); Microsoft’s first cluster of that generation, 4,608 GPUs in 64 racks, is about 18,000 modules on that ratio, and Microsoft calls it “the first of many” as it scales to “hundreds of thousands” of those GPUs (Azure, October 2025). Cignal AI counted nearly 20 million 400G-and-faster modules shipped in the first quarter of 2026, 800G the majority and tripling (Cignal AI, June 18). The buyers’ money is committed years forward: Microsoft’s calendar-2026 capital spending is about $175 billion with the next fiscal year growing (its fiscal fourth-quarter call); Amazon’s cash capital spending was $96.3 billion in the first half of 2026, “primarily” investments in technology infrastructure, and it expects the spending to increase (its Q2 10-Q). Against that, AAOI’s 650,000-a-month exit-2026 ladder is 7.8 million modules a year, about a tenth of the 2027 pool on this note’s own arithmetic, and about a fifth of what its two named buyers alone consume. Whether the demand exists is not the question; whether the buyers allocate it to this maker is, and they allocate on supply security, on origin and on qualification.
The company says it is supply-bound and sold out, and it puts numbers on both. “Demand to support next generation AI infrastructure remains so robust that our near-term revenue is bounded almost entirely by production capacity and key component availability”; “the customer demand is 20%–40% higher” than what can be built, with customers pressing “almost every week, every month, to speed up our delivery schedule”; a “complete book already from now until Q2 next year” (the Q2 call); “really sold out at least through second half of next year and beyond” (the fireside). The mid-2027 picture, given on the May call and repeated in August: “$471 million per month of data center transceiver revenue,” about $90 million of it 100G and 400G, $217 million 800G and $164 million 1.6T, “based on the orders in hand or minimum commitments from customers, plus the equipment fully qualified,” “revenue, not capacity,” “equal to about 780 thousand transceivers per month.” Three-year agreements “with several customers — around three — including lasers and the ELSFP” are in negotiation (the Q1 call; “several on the table” at the fireside), and the company is the reluctant party: an agreement “does come with a price,” and one customer locking up “too much of our capacity” could deter others (the fireside).
The fill is set below the nameplate by the company’s own conversion record, which is the receipt for the judgment. 800G revenue was $4.6 million in the first quarter on lines reaching 100,000 a month at quarter-end, and $12.8 million in the second with capacity approaching 200,000, 2.8 times in revenue against the “nearly four times the quantity” the company had guided in units, a smaller shortfall in units if the 800G price fell between the quarters; the 800G line came in below its expectation in the fourth quarter of 2025 on a customer’s firmware work; the first volume 1.6T qualification was “within the next couple of weeks” on August 6 and had not been announced by the 18th, when the chief financial officer said a second 800G customer was “not for a full qualification at this point” on 1.6T; the December 1.6T revenue — the $70 to 80 million an analyst put to the company at the fireside, which it did not take up — is gated by the digital signal processors and amplifiers the company buys, on which it is “the fourth priority” at its suppliers (the Q2 call; the fireside). Shipped output in a quarter runs on the capacity installed a quarter earlier, less the qualification and cycle-time drag of new lines, and the fourth quarter shows it: about $330 million of 800G and 1.6T — an analyst’s arithmetic the chief financial officer confirmed “directionally” — against a quarter-average installed capacity near 500,000 a month is a realization under half of the nameplate, which is what a ladder climbing from 350,000 to 650,000 inside a quarter produces. Run forward, that gives about 1.1 million modules in the first quarter of 2027 (the chief executive’s “60%, 70%, or even 80% growth in each quarter … even in Q1 next year too,” applied to the fourth quarter’s units), 1.4 million in the second, 1.8 million in the third and 2.0 million in the fourth: 6.31 million modules in 2027, 66% of the year’s average capacity of about 790,000 a month, of which 1.38 million are 1.6T — the first quarter at double the fourth quarter’s 1.6T revenue, as the chief executive guided, then about 310,000, 400,000 and 480,000 — and 4.93 million 800G. For 2028 the note carries capacity continuing to about 1.2 million a month by year-end, on the second half’s investment “at least as big as the first,” the cleanroom contract due in January 2027, the Pearland buildings bought outright and the chief financial officer’s answer on 2027 and 2028 investment, “Why wouldn’t we?”, and a fill of 75%: 9.42 million modules, 4.40 million of them 1.6T, which assumes the second hyperscaler’s 1.6T qualification closes by then. No commissioned 2028 ladder is disclosed; that base and that fill are this note’s judgment, and section 3 prices the readings on either side of it.
Management’s own picture is above this path, and it is not used as an input. $471 million a month by mid-2027, ramped from the fourth quarter’s exit rate and run through the 2027 capacity, is about $5.0 billion of 2027 data-center revenue at full utilization; the path carries $3.7 billion. The difference is the lag and the two-thirds realization the 2026 quarters show, not a doubt about the demand.
So the ladder is the physical fact and the fill is the judgment: two-thirds in 2027 and three-quarters in 2028, on a book the company says is sold out, with the gates the company itself names carried as the reason the fill is not higher. The receipt that would move it is the second 1.6T qualification, which no filing dates.
Thesis 3: AAOI’s laser fab becomes a second product line from late 2027, selling lasers and external laser sources into a market its competitors say is short
The next packaging step keeps the laser outside the package. Co-packaged optics move the optical engine from the pluggable module onto the switch chip’s package, and the light still has to come from somewhere: the industry’s co-packaging framework places the laser source either inside the package or outside it as a pluggable module of its own (the OIF’s framework), and the external form is the one the first systems use. NVIDIA’s first co-packaged systems are “now in production,” with CoreWeave, Lambda and Oracle Cloud Infrastructure named among the first adopters (NVIDIA, May 31), and the partners it named for them at the announcement include Lumentum and Coherent and not AAOI (NVIDIA, March 18, 2025). Cignal AI sizes the external-laser-source module market above $100 million in 2026 and above $1.5 billion by 2030 on more than 30 million co-packaged ports a year, with growth from 2027 and the large-scale build-out in 2029 and 2030 (Cignal AI, May 12).
The two makers named for that market cannot serve it at large. Coherent will not sell lasers externally in the near future, and Lumentum’s demand is outpacing its supply with its Japan fab capacity fully allocated, in their own words in thesis 1. That is a declared-short market whose two named suppliers are captive or allocating, at the layer this company already fabricates.
AAOI is building for it and turning it away today. The company intends to sell high-power lasers and external-laser-source modules for co-packaged optics from late 2027, at margins it puts at “about 55%–65%” for the laser and “more than 50%” for the module, with “several of the major CPO customers” who “love our laser” and five companies it is talking to about CPO — “I don’t know if we’ll get all five. That’s probably a stretch because we probably don’t have enough capacity to meet everybody’s demand there” (the fireside); it is sitting out the first-generation deployments because “we just can’t make enough of them … We have to prioritize our ability to make lasers for our own transceivers first” (the Q1 and Q2 calls). The construction is registered: a 110,000-square-foot “ISO 7 or ISO 6” cleanroom at $32.0 million, filed with the State of Texas in February as “Fab 2,” and a third building of 72,610 square feet filed in March as “Fab 3” — neither record says what the building makes (the Texas registrations; TABS2026016172); the laser capacity target is “almost 300%” more by the third quarter of 2027, with a second fab “about four times” the size of the first planned after it (the Q2 call).
The note carries the line as an entrant, not at management’s number. Management’s target of “about 400 thousand pieces per month” was “by 2027” on the May call and “in 2028” on the August call, no counterparty has named the company for lasers or external sources, and at the prices the bulls themselves put on the modules that figure is $2 billion a year or more against a market Cignal puts above $1.5 billion in 2030. So the path carries the line from $20 million in 2027 to $450 million in 2030 and $830 million in 2035: a fifth of Cignal’s 2030 series, $300 million, plus $150 million of merchant dies from a fab expanded three- to four-fold — the dies this note’s own judgement, sized by no source — at a 55% to 58% cash margin.
So the fab that holds the module margin’s floor is also a product line entering a market whose named suppliers are captive or full, from late 2027, and the note prices it at a fifth of a public series rather than at the company’s own aspiration. Its first customer is the receipt that would size it, and none is filed.
3. Valuation
A discounted-cash-flow model on one operating path, the second half of 2026 through 2035, on the June 30, 2026 balance sheet, valued two ways that agree by construction: the window to 2035 with a perpetuity after it, and the same window cut at 2031 with an exit multiple derived from the first’s own later cash flows. The workbook carries every line; the pictures and the tables in this section come out of it.
Exhibit 1. The model’s accounts by year, from the workbook’s financial summary sheet: revenue by the company’s own lines, the module volumes by generation, the margins, operating profit, EBITDA, earnings per share and free cash flow, 2023 to 2035. The shaded cells are the editable inputs.
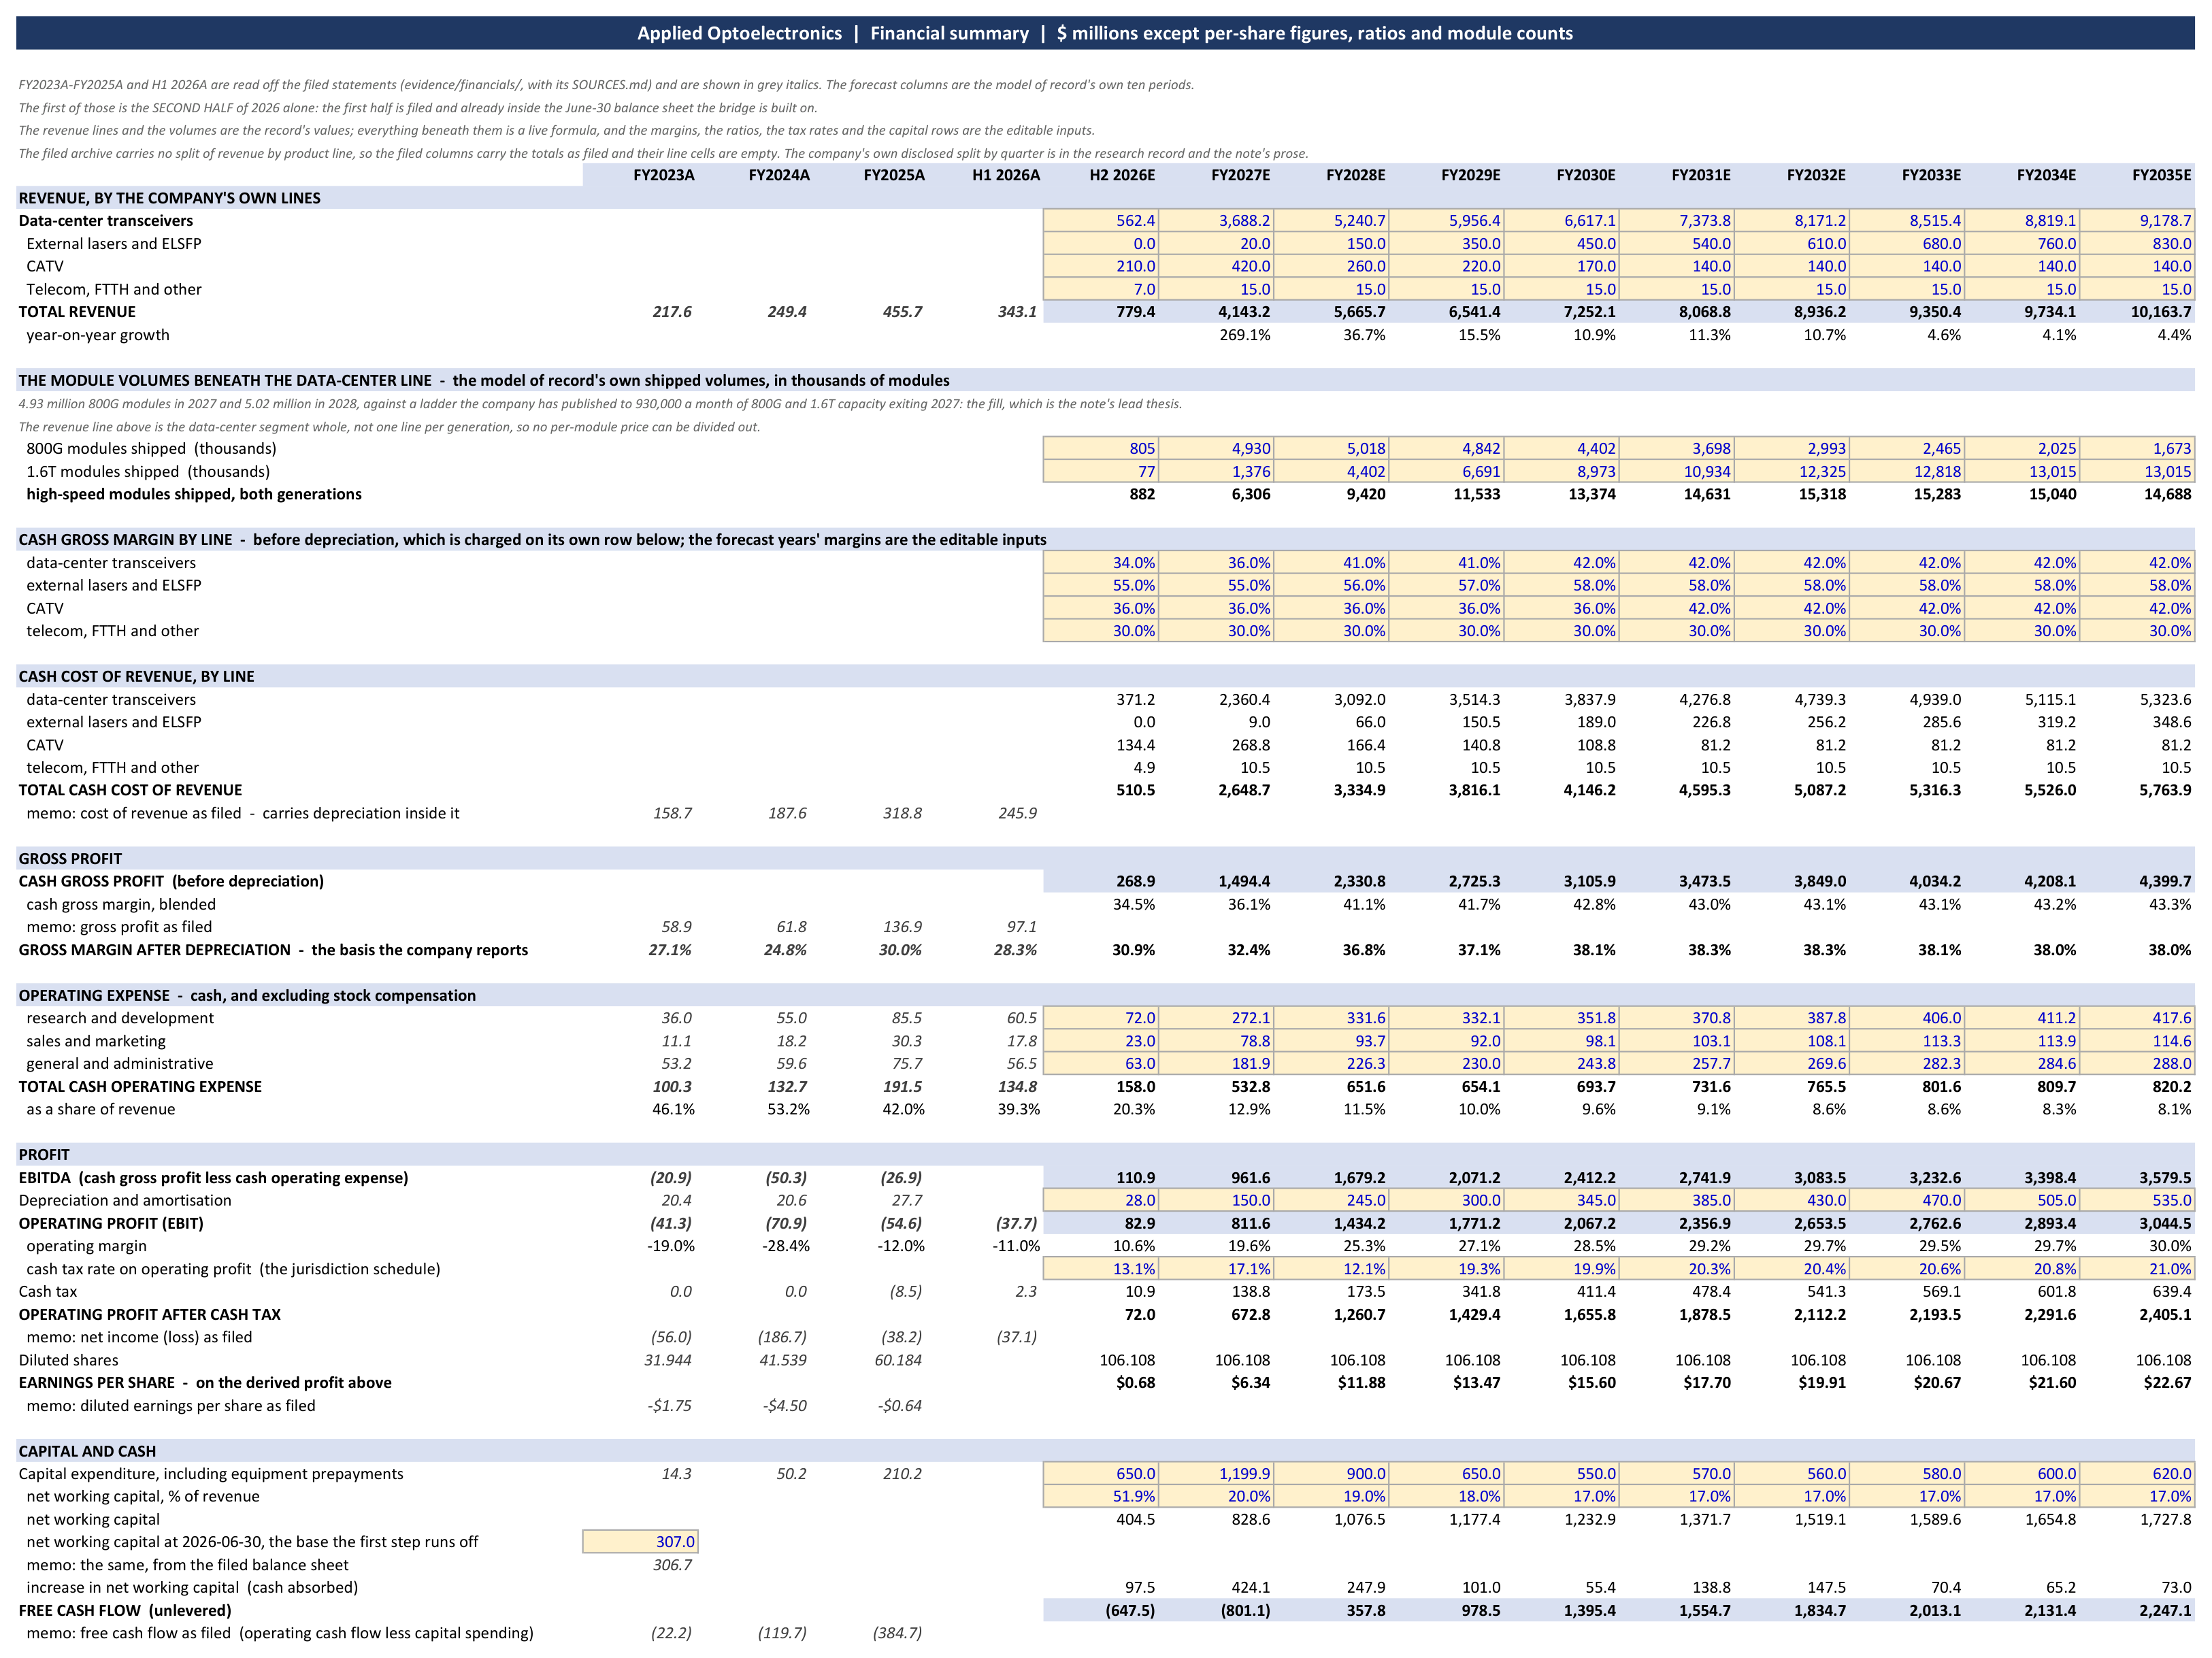
Source: the model attached, Financials sheet; 2023 to 2025 and the first half of 2026 as filed.
What sets the key values in the sheet, line by line.
Through 2026 the company’s own guide sets the numbers. The third quarter inside the $255 to 290 million guide with cable at the midpoint of its $100 to 110 million; the fourth quarter at management’s “more than $500 million” taken at its floor, with 800G and 1.6T at about $330 million (an analyst’s arithmetic the chief financial officer confirmed “directionally”) and 1.6T at about $75 million for the first order’s December tranche — the $70 to 80 million an analyst put to the company at the fireside was not taken up, and is not the company’s guide; a 2026 of about $1.12 billion, the company’s “around $1.1 billion” reached from the units up.
From 2027 the volume is the published ladder at a fill the conversion record supports. 6.31 million 800G and 1.6T modules in 2027 and 9.42 million in 2028, two-thirds and three-quarters of the average installed capacity as thesis 2 sets out, with the legacy 100G and 400G book at about $700 million in 2027 and $600 million in 2028. From 2029 the company’s share of a pluggable pool growing about 10% a year rises from about 8% to 9% by 2032 and holds, bounded below 10% because no customer has committed the volume and the buyers dual-source by design; the product after 1.6T enters in 2029 on the same lines at the same share. The 2027 fill at 60% instead of 66% is worth $218 a share; the second 1.6T qualification a year late, $248; the fill the first version of this note carried, three-quarters and 85%, $299.
Module prices hold while the shortage lasts and then fall on the filed curve. 800G at $380 in 2027 and 1.6T at $810, inside the $350 to 400 one maker reported for 800G in 2025 in an investor-relations record (CIG Shanghai) — the same record puts 1.6T above $1,000 this year and converging toward 1.5 times 800G in volume, where this path runs 2.1 times in 2027 and 1.7 at the end, because the volumes are not equal — and the “fairly stable in 2026–2027” that LightCounting’s May revision carries while the shortage lasts (LightCounting, May 2026); then $345 and $661 in 2028 and $295 and $574 in 2029 as supply catches demand around mid-2027 and the decline resumes at 12% to 15% a year, this note’s judgement inside the 10% to 25% a year Innolight’s own 2021 project model budgeted for its products (20% for 800G in its first years, and no 1.6T line at all), moderating after 2031 for a generation past its volume peak — a rate no source states. Crealights’ own 800G-and-above average fell 36% in a year, from RMB 2,443 to RMB 1,557 on its own table, “primarily due to relatively intense market competition during the early stage of commercialization,” with its 200G and 400G prices falling under “large-volume procurement arrangements which strengthened customer bargaining power” (its listing document, p. 134) — competition once a generation is commercial and the buyers’ scale after it, which is the curve’s mechanism and the reason the note does not hold the shortage price. A 3% premium is carried on the Texas-built output, the middle of a band whose top is the 7.5% Section 301 duty China-origin transceivers already carry (heading 8517.62, which USTR’s July action left where it was — the notice) and whose bottom is nothing against Taiwan- or Thai-origin supply; the chief financial officer’s “they’re willing to pay a premium for U.S. production” (the fireside) is carried at that band and no higher. The curve held at 20% a year from 2027 with no premium is worth $159; the shortage clearing a year later than the path’s mid-2027, on a buyer’s date, $267; the premium at zero, $246.
The data-center margin is 36% in 2027, 41% in 2028 and 2029 and 42% from 2030 in cash terms, 32% and 37% after depreciation in 2027 and 2028. The level is the scaled makers’ pre-shortage anchor, less the capped Microsoft book and the U.S. cost, plus the laser the company does not buy; the path sits two points below that arithmetic while the new lines start up and the shortage runs its clock, and at it from 2030. That is thesis 1 as a number, and it is the second-largest thing the value rests on: the margin settling at this company’s own 2019 shape, peaking at 37% and falling to 32%, is worth $167; the anchor’s own arithmetic in the ramp years as well, $252; the shortage margin held through the horizon, $268.
The laser line is $20 million in 2027 rising to $450 million in 2030 and $830 million in 2035, at a 55% to 58% cash margin. Thesis 3 as a number; none of it is worth $209, the sized fifth alone with the dies at zero $237, and twice it $290.
Cable peaks in 2027 and steps down. $420 million in 2027, $260 million in 2028, then $220, $170 and $140 million from 2031, at a 36% cash margin rising to 42%. Charter’s network evolution is expected to be “largely complete by the end of 2027” on its FY2025 10-K, a finish its second-quarter release restates as “in 2027,” and its capital expenditure is guided for 2026 as a whole, about $11.4 billion, with the program’s own spending published only in arrears; Dell’Oro dates the global cable outside-plant equipment cycle’s peak to 2027 (Dell’Oro, July 30). Management’s “over $325 million annually” is the level, and the note carries it for 2026 and 2027; holding it from 2028 as well, with the other operators filling the step, is worth $257. The distributor’s $211 million of receivables leaves the working capital with the program.
Operating expense is 13% of revenue in 2027 falling to 8% by 2035; working capital absorbs 20% of revenue falling to 17%; capital spending is $1.20 billion in 2027 and $900 million in 2028, then about 6% of revenue. The cost base runs from the “$70 million–$80 million per quarter” guide and settles a point above the scaled makers’ ratios on a U.S. cost base carrying a second product line’s research, with about $12 million a year of the costs the company calls non-recurring left inside it. The capital program is the company’s own: the 930,000-a-month ladder’s completion, the laser fab’s expansion and the second fab, gross of the $20.9 million Texas grant announced in April, which the note does not net until it is received, then capacity toward 1.2 million a month, then 6% of revenue for generation turns; depreciation follows the filed asset lives at their midpoints. Working capital falls from the $0.40 per dollar of revenue the June balance sheet carries, inflated by the distributor’s terms and the pre-ramp material build, toward the scaled makers’ ratios as hyperscaler terms dominate the mix. Cash tax is the filed jurisdictions’ schedule on each year’s operating profit, 17% in 2027 and 12% in 2028 as the U.S. loss carryforwards and regular depreciation shelter the Texas output, rising to 21%; the company “does not intend to elect bonus depreciation” (the 10-K), and the note takes it at its word. Capital a quarter heavier throughout is worth $225; stock compensation is charged once, in the share count.
Exhibit 2. The discounting, from the workbook’s valuation sheet: the cash flows of the second half of 2026 to 2035 at the rate schedule, the perpetuity, the exit-multiple instrument beside it, and the value on both.
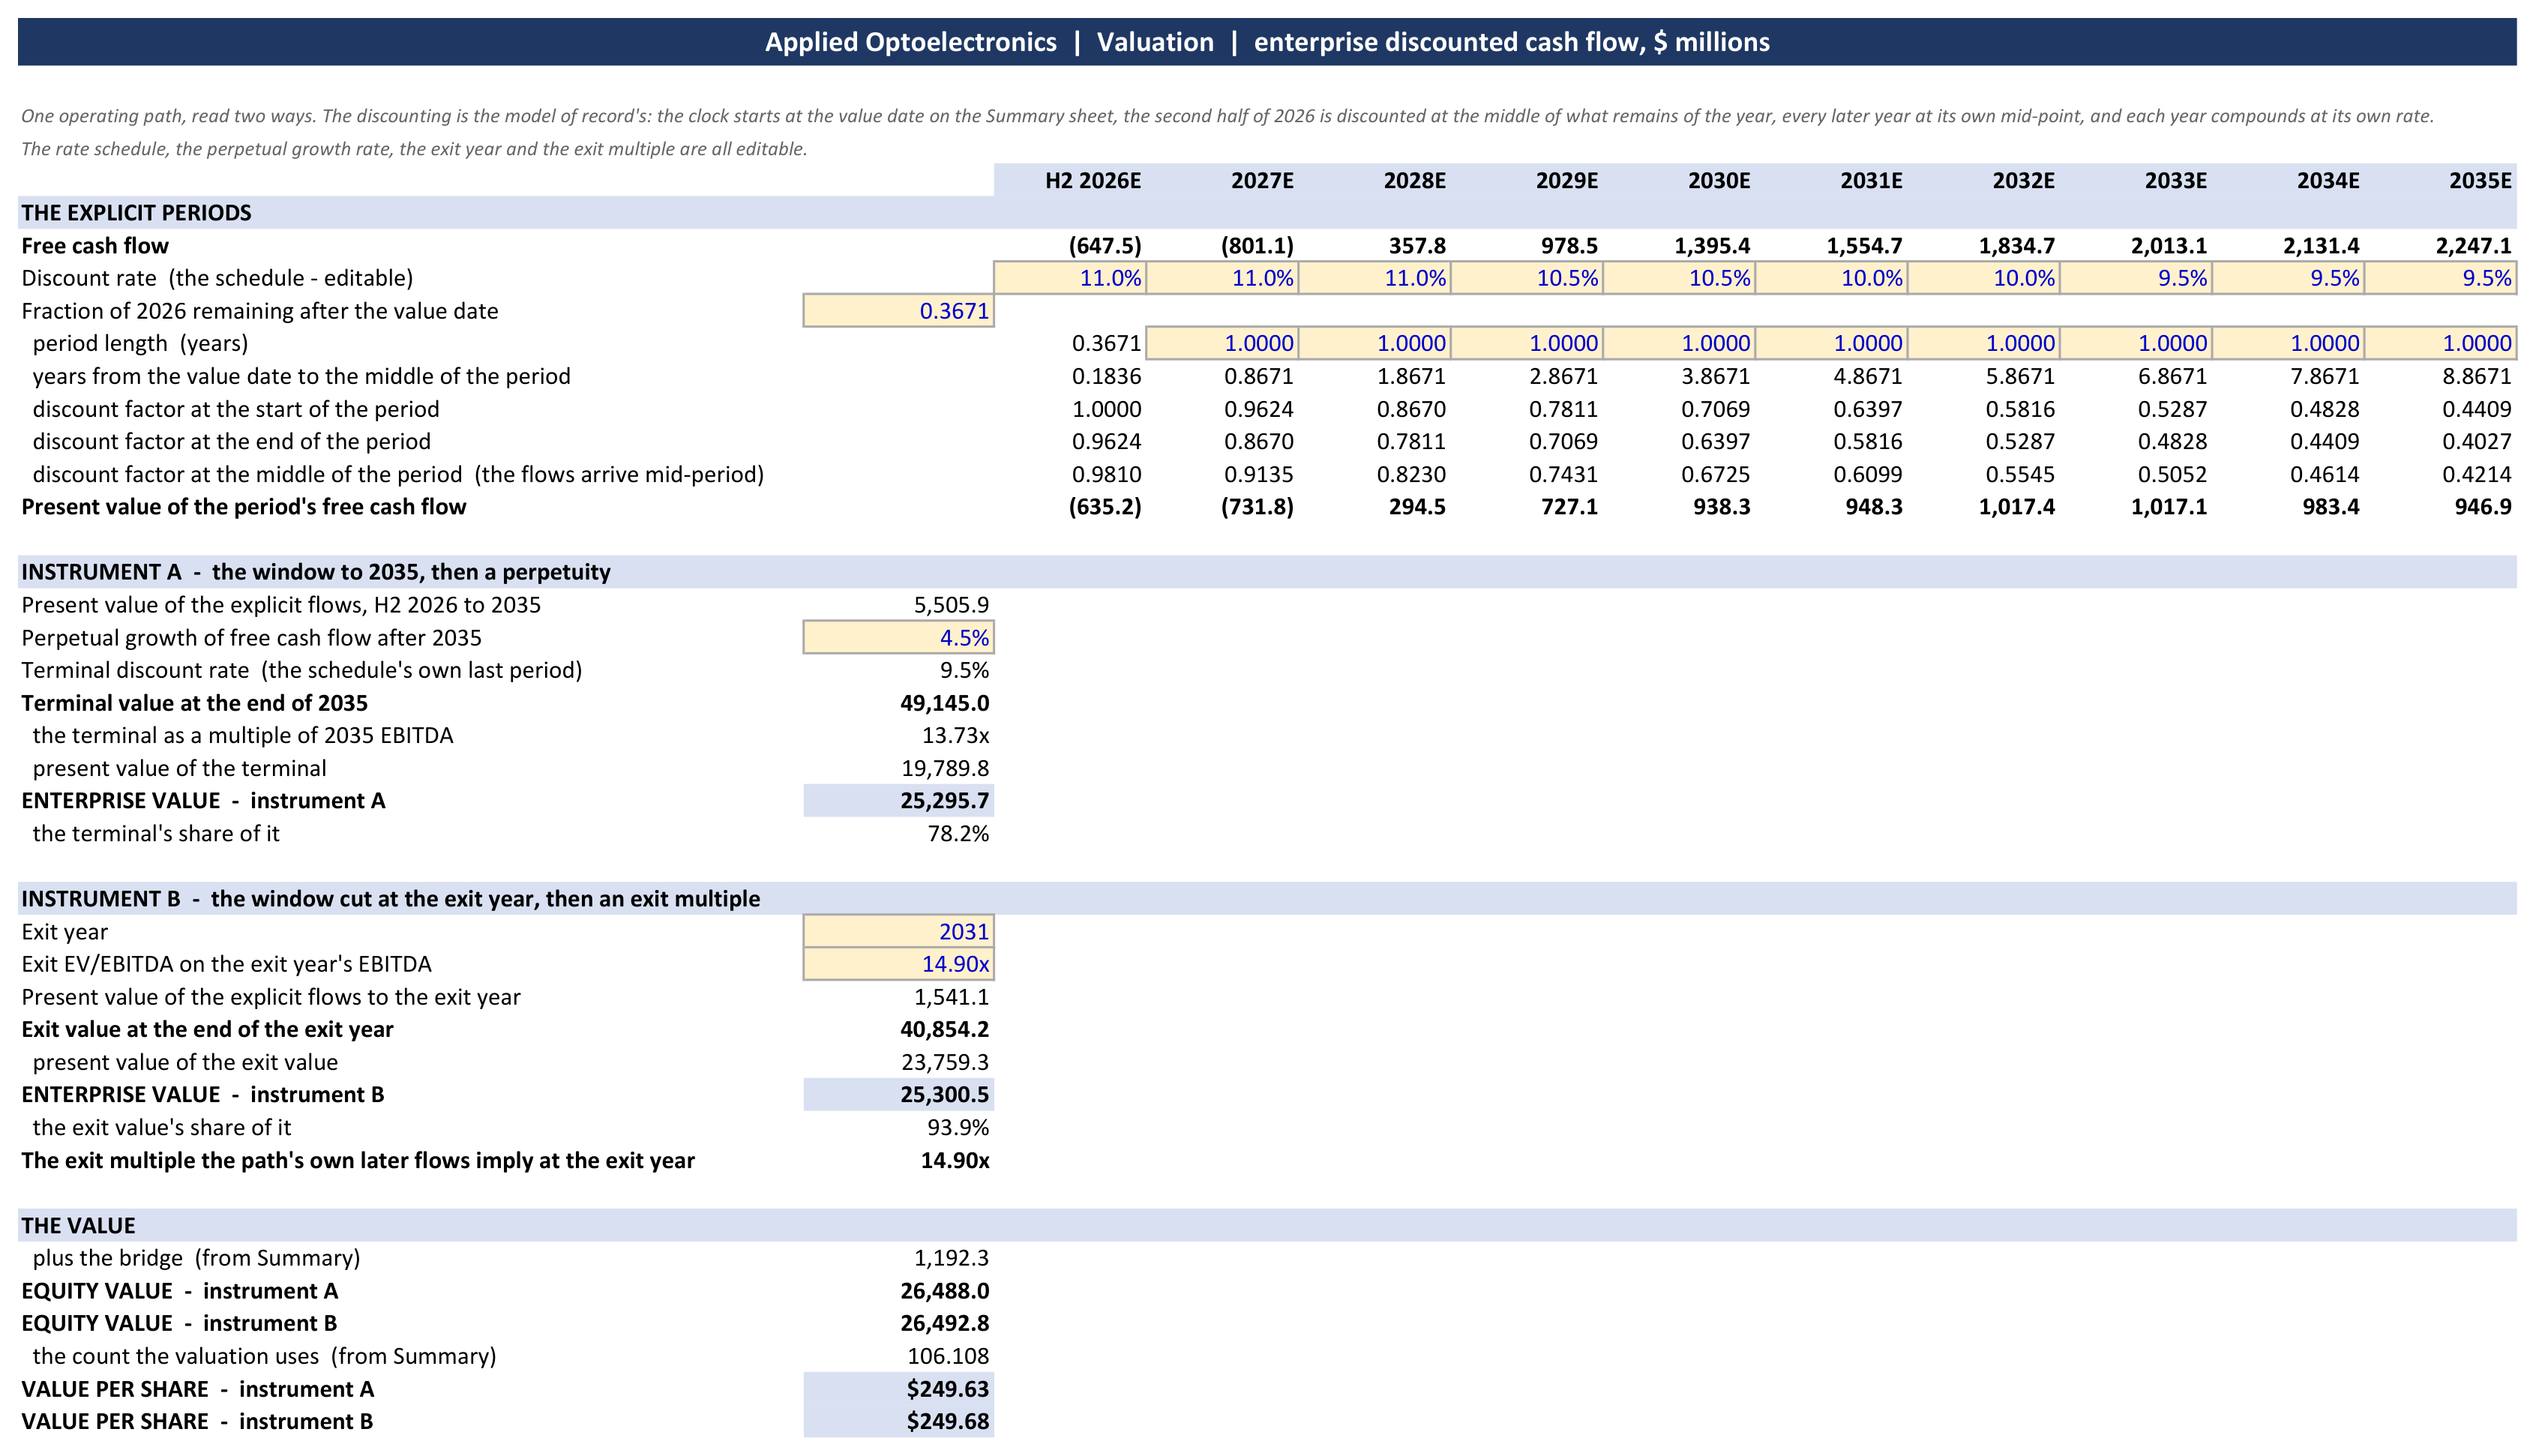
Source: the model attached, Valuation sheet.
What sets the discounting and the horizon.
The cost of capital is a schedule: 11% through 2028, 10.5% in 2029 and 2030, 10% in 2031 and 2032, 9.5% from 2033 and for the perpetuity. The floor is what the company’s own capital demonstrably costs: it borrows on a collateralized basis over twelve years at 4.77%, the weighted-average rate on its leases at June 30 (the 10-Q); its 2.75% notes due 2030 carry a low coupon because the conversion right at $43.31 was sold with them; and its own estimate of its equity’s volatility, the input it used to value the Amazon warrant, is 80% a year. The premia above the floor are the residual the path does not model, each on a clock: the allocation judgment, resolved by 2028 with the second 1.6T qualification and the long-term agreements; execution on a capital program ten times the company’s prior one, built by 2030; and the regime risk of an equity the market reads through its own 2017 to 2019 history, fading as the base is absorbed. The ramp years sit about six points above the collateralized floor and the terminal about five; a point on the whole schedule is worth $203 to $319, and Exhibit 5 shows it.
The horizon runs to 2035, because the contested clocks settle by 2031 or 2032. The 2027 fill, the shortage’s end and the price curve’s resumption, Charter’s program, the 1.6T node and the co-packaged relocation, and the second fab’s laser business all settle in the sense a terminal needs: the margin, the capital intensity, the working-capital ratio and the growth rate reach steady state while product generations go on turning. 2035 is a settled year, with revenue growing 4.4%, and the perpetuity is struck on it: free cash flow after 2035 growing at 4.5%, the rate the path’s own last three years carry, at 9.5%, its flows mid-year like the explicit years’. That terminal is $49.1 billion at end-2035, 13.7 times 2035 EBITDA and 78% of the enterprise value; each half-point of perpetual growth is worth $10 to $21 a share at the schedule. Cut at 2031 instead, the same path’s 2032 to 2035 flows and that terminal are worth 14.9 times 2031’s EBITDA of $2.7 billion, so the second instrument’s multiple is derived from the first and the two agree to five cents, the multiple stored to one decimal; the grid in the workbook runs the multiple from 8 to 14 times.
The output: $25.3 billion of enterprise value, $26.5 billion of equity after a $1.2 billion bridge, $250 a share on 106.1 million shares. Revenue runs $4.1 billion in 2027, $5.7 billion in 2028, $7.3 billion in 2030 and $10.2 billion in 2035; EBITDA $962 million in 2027, $1.7 billion in 2028 and $2.4 billion in 2030; free cash flow is negative $647 million in the second half of 2026 and negative $801 million in 2027 as the ladder, the second fab and a $3.0 billion revenue step’s working capital are paid for, turns positive in 2028 and reaches $1.4 billion in 2030. The enterprise value is 15.1 times this note’s 2028 EBITDA and 10.5 times 2030’s. Exhibit 3 carries the bridge and the count.
Exhibit 3. From the enterprise value to the value a share, from the workbook’s summary sheet: the bridge at the June 30 balance sheet with the financing since it, and the count the valuation uses.
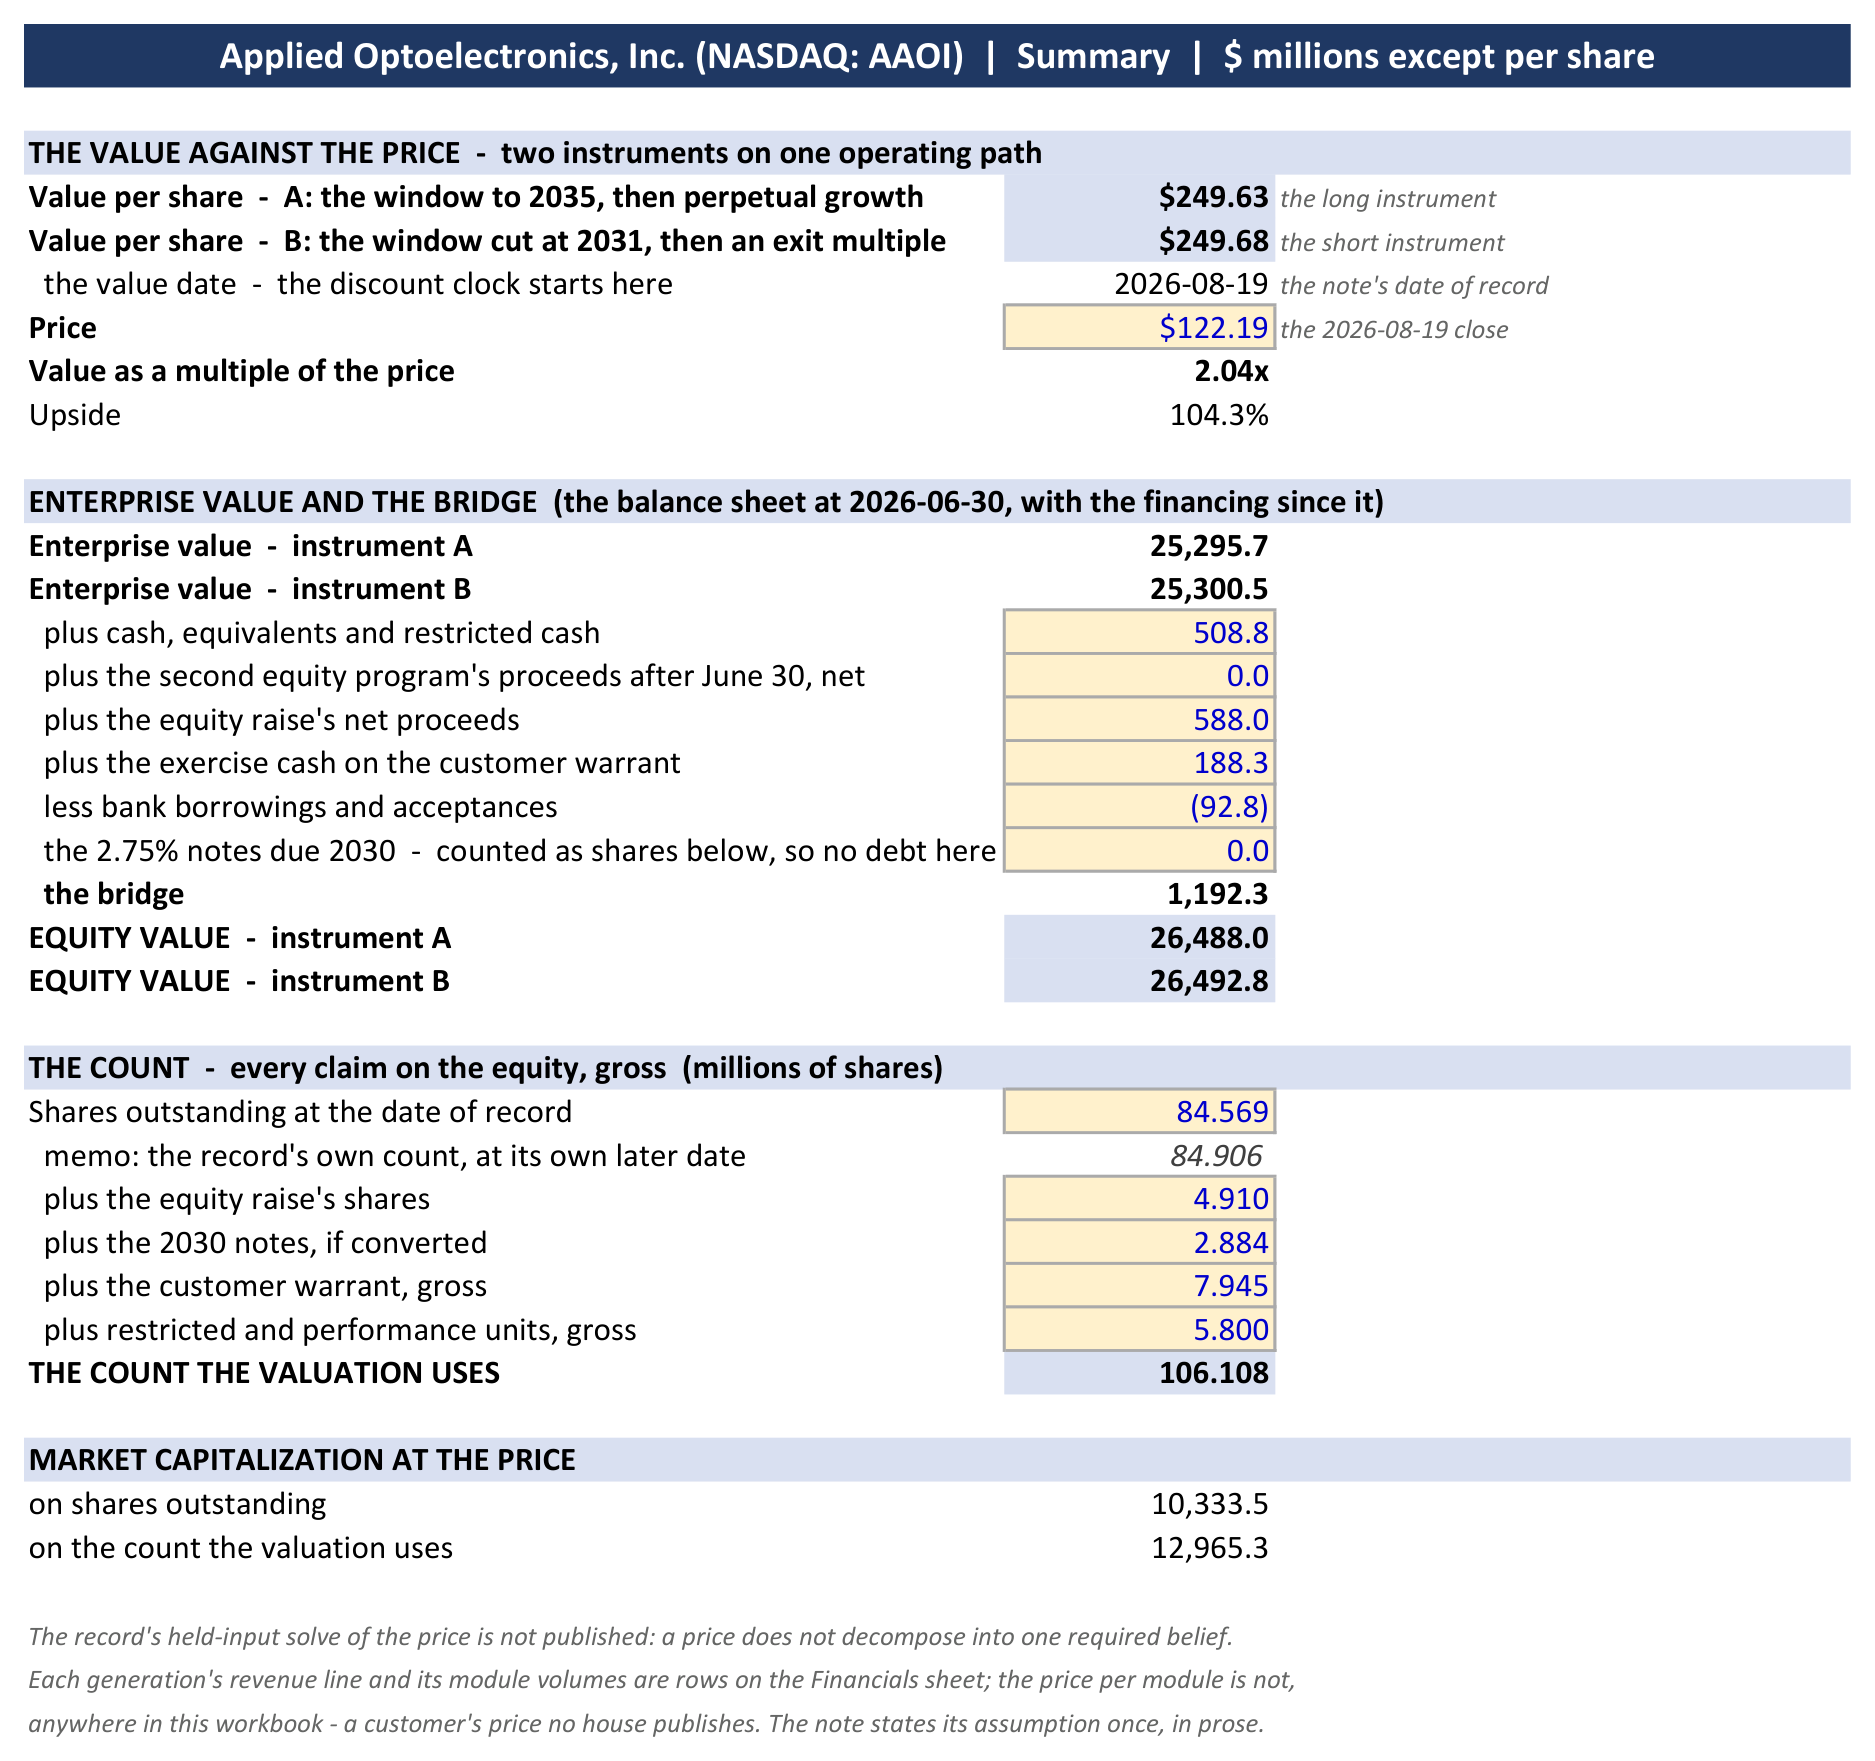
Source: the model attached, Summary sheet.
The count carries every claim on the equity gross, with its cash in the bridge. 84.6 million shares outstanding at August 3 on the 10-Q’s cover; the 2030 notes as 2.9 million shares at $43.31, with no debt for them; the Amazon warrant’s 7.9 million shares gross, with its $188 million of exercise cash in the bridge; 5.8 million of restricted and performance units; and 4.9 million shares for a further $600 million of equity, the size of the program just used, which the second half’s investment and 2027’s cash consumption need beyond the cash on hand, at the August 19 close, on the funding order the chief financial officer described at the fireside — equity, which the company has been leaning on, then cash from operations, customer contributions, debt structures and government subsidy — with its $588 million of net proceeds in the bridge. That raise not taken, financed with debt or customer money instead, is worth $256; the dilution is a real transfer and it is priced once, here.
Against the published estimates. This path runs above consensus on revenue in every year the vendor publishes one, by about half in 2027 and two-fifths in 2028, and below it on gross margin in both, so the disagreement is volume and only volume; the return is that gap closing as the modules ship, at whatever price it happens.
Exhibit 4. This model’s estimates against the published consensus, by year.
| FY2026E | FY2027E | FY2028E | |
|---|---|---|---|
| Revenue, this model ($ million) | 1,122 | 4,143 | 5,666 |
| Revenue, consensus | 1,038 [5] | 2,663 [4] | 3,964 [1] |
| Gross margin after depreciation, this model | — | 32.4% | 36.8% |
| Gross margin, consensus | 30.4% [5] | 33.7% [4] | 37.6% [1] |
| EBITDA, this model | — | 962 | 1,679 |
| EBITDA, consensus | 118 [1] | 440 [2] | none |
| Operating profit, this model | — | 812 | 1,434 |
| Operating profit, consensus | 48 [5] | 546 [4] | 1,119 [1] |
| Earnings per share, this model | — | $6.34 | $11.88 |
| Earnings per share, consensus | $0.68 [6] | $4.60 [5] | $8.91 [1] |
| Capital expenditure, this model | — | 1,200 | 900 |
| Capital expenditure, consensus | 635 [1] | 400 [1] | none |
Source: S&P Capital IQ consensus pulled August 16, 2026, the contributor count in brackets; the model attached, Estimates sheet. This model’s 2026 is the filed first half plus its own second half, and only revenue adds across the two bases. Its EBITDA carries no stock compensation as an expense, which is charged once in the count, and no interest income; its earnings per share divide operating profit after cash tax by the 106.1 million count, while the vendor’s normalized line carries interest and excludes exceptional items. The vendor’s FY2027 EBITDA line has two contributors and sits below its own four-contributor operating-profit line, which is impossible for one company-year; every FY2028 line is one analyst.
Where the value would be wrong, and by how much. The scenarios are readings I refused and priced, one input moved at a time from the path with the rest held; Exhibit 5 gives each with what it requires and the value on both instruments.
Exhibit 5. The cases, what each requires, and the value a share on the ten-year instrument and the exit-multiple instrument.
| The case | What it requires | A | B |
|---|---|---|---|
| The last cycle reproduced whole | the 2027 fill at 60%, the margin settling at the 2019 shape, and the learning curve at 20% a year from 2027, together | $81 | $122 |
| The pluggable business ends at 1.6T | no product after 1.6T on the same lines | $112 | $190 |
| Network flattening, a third | the buyers’ pluggable module count a third lower from 2029, the bound’s full size | $141 | $157 |
| The standing counter-case | the 2027 fill at 60% and the margin at the 2019 shape, together | $143 | $159 |
| The learning curve at 20% a year | the filed decline rate held from 2027, no premium on the Texas output | $159 | $197 |
| The margin at the last cycle’s shape | the data-center cash margin peaking at 37% in 2028 and settling at 32% | $167 | $180 |
| Network flattening, a fifth | the buyers’ pluggable module count a fifth lower from 2029 | $184 | $194 |
| The rate a point higher | 12% through 2028 stepping to 10.5% | $203 | $238 |
| No external laser line | the fab a cost center for the company’s own modules only | $209 | $220 |
| The 2027 fill at 60% | the smaller base carried through the window | $218 | $223 |
| The share of the pool held flat | 8% from 2029, the growth capital scaled back with it | $223 | $231 |
| The laser line at the sized fifth alone | $300 million in 2030, the merchant dies at zero, the tail scaled with it | $237 | $240 |
| The second 1.6T qualification a year late | 2028 at 3.1 million 1.6T modules and 5.5 million 800G | $248 | $248 |
| This note’s path | as above | $250 | $250 |
| The equity raise not taken | debt or customer financing instead | $256 | $256 |
| Cable held above $325 million | the other operators filling Charter’s step-down from 2028 | $257 | $257 |
| The shortage clearing a year later | 2027’s levels held through 2028, the curve’s decline shifted a year later | $267 | $282 |
| The shortage margin held | the data-center cash margin at the scaled makers’ level, 38% in 2027 and 44% from 2028 | $268 | $266 |
| The laser line at twice the path | twice the path’s line in every year, $900 million in 2030 | $290 | $279 |
| The ladder filled at three-quarters | 7.1 million modules in 2027 and 10.7 million in 2028, with the cost path that reading carried | $299 | $292 |
| The rate a point lower | 10% through 2028 stepping to 8.5% | $319 | $262 |
Source: the model attached, Scenarios sheet.
The top row is this company’s own 2017 to 2019 reproduced on today’s base with the margin’s floor removed, and the price sits between it and the standing counter-case: the market is paying for something more adverse than the last cycle’s shape with the laser’s floor taken out, and nothing on the present record supplies it. The one reading that reaches below the price on the ten-year instrument alone is the pluggable business ending at 1.6T, the arithmetic of ending a fab and a set of lines built to move to the next generation at the last product generation they have been named for. The gap between the counter-case and $250 is the margin’s floor and the fill, and the gap between $250 and the readings above it is what the note refuses to claim.
The sensitivity. Exhibit 6 moves the whole cost-of-capital schedule against the perpetuity’s growth on the ten-year instrument; the workbook carries the second grid, the schedule against the exit multiple, and on it every cell at the schedule from 8 times up clears today’s price.
Exhibit 6. The cost-of-capital schedule shifted in parallel, against the perpetual growth rate after 2035; value a share.
| The schedule | 2.0% | 3.0% | 4.0% | 4.5% | 5.0% |
|---|---|---|---|---|---|
| two points lower (9.0% → 7.5%) | $265 | $311 | $382 | $436 | $511 |
| a point lower (10.0% → 8.5%) | $218 | $248 | $290 | $319 | $357 |
| as modelled (11.0% → 9.5%) | $184 | $205 | $232 | $250 | $271 |
| a point higher (12.0% → 10.5%) | $159 | $173 | $192 | $203 | $217 |
| two points higher (13.0% → 11.5%) | $139 | $149 | $162 | $170 | $180 |
Source: the model attached, Sensitivity sheet.
Every cell clears the price; the lowest corner, two points higher on the whole schedule with 2% growth, is $139 against $122.19.
What I am not claiming. The four favourable readings the note refuses, taken together on the operating rows, give $349; with the rate a point lower as well, $445; a 20% share of the pool by 2032, carried with the capital and the cost it needs, gives $546 on the ten-year instrument. All three are above my number and none is my claim. The claim is a margin with a floor, a ladder filled on its own record and a laser line at a fifth of a public series, on a cost of capital and a terminal I have not set generously.
4. Management and incentives
The executives are paid on the share price, not on the quantities this note rests on. Half of each named executive’s 2025 equity grant is performance units that pay between 0% and 200% of target on total shareholder return against the peer group and on a stock-price hurdle to April 2028, $32.16 for 25%, $36.98 for 100% and $48.01 for 200%, earnable at any point in the period (the 2026 proxy); the 2022 units on the same terms paid at the maximum in April 2025, 446,428 shares to the chief executive against 223,214 at target. Every hurdle sat far below the price by mid-2026. Nothing in the equity awards pays on revenue, margin, cash or capacity; the annual cash bonus does, a quarter of it on revenue and a quarter on non-GAAP operating income, and it paid at 105% of target for 2025.
Insiders sold into the run and have bought nothing since the trough. Between December 2025 and August 2026 the officers and directors sold about 877,000 shares for about $120 million, at prices from about $30 in December to about $205 in June (the Forms 4): the chief executive 117,000 at $166 to $173 in May and June after 711,743 shares of his performance units vested in May, the chief financial officer 122,000, about half of them under a plan adopted in August 2025, the two general managers about 290,000 between them. The last open-market purchases were in August 2025 at $21 to $23, 56,784 shares across the chief executive and three directors. The chief executive adopted two further sale plans in May 2026, for up to 224,000 shares through August 2028 (the 10-Q, Item 5). There is no buyback.
The company sold $1.05 billion of stock in the first half and says equity comes first. The first at-the-market program sold 4.83 million shares at a weighted $103.51 and closed in April; the second sold 2.94 million at $181 to $197 in May and June, on a $600 million authorization nearly used by the quarter’s end (the 10-Q). Capital spending in the second half is guided “at least as big” as the first half’s $335 million, and the order the chief financial officer gave on August 18 was equity so far, then cash from operations, customer contributions, debt structures and government subsidy, adding that “raising everything on the back of equity for the foreseeable future is not our plan.” The 2030 convertible notes are $124.9 million of principal converting at $43.31, deep in the money; the Amazon warrant is the other claim, earned by buying.
What the company does not publish, and never has. Units shipped, prices per module, backlog or bookings, and customer revenue beyond the concentration percentages; the capacity ladder, the mid-2027 picture and the sold-out duration are spoken on calls and at conferences and appear in no filing, and the company publishes a webcast and no transcript. The one line that has stopped is fiber-to-the-home, a few thousand dollars a year, folded into “other” in the FY2025 10-K. That is why the ladder in section 2 is cited to calls, and why the fourth quarter, the first period both the company and the estimates have put a figure on, is the first test.
5. Catalysts
- The third-quarter results, in the first week of November on the company’s pattern (thesis 2, thesis 1): the fourth-quarter guide against “more than $500 million”; the second hyperscaler’s 1.6T qualification; the internal share of the lasers restated; the at-the-market table in the 10-Q.
- The FCC’s further notice on components from Chinese producers, comments due September 8 and replies September 21 (the Third Further Notice in FCC 26-50, published at 91 Fed. Reg. 51139 on August 7): the transceiver question is put there, not decided; a rule reaching transceivers by producer would change the allocation in thesis 2 and nothing in the price rows.
- Charter’s third-quarter results, in late October (the cable input): the network-evolution spending, published in arrears, against 2025’s $1.1 billion and the $1.6 billion of the twelve months to June.
- The FY2026 10-K, in February: the year’s capital spending, the equipment commitments, the customer concentration table, and the first filed figure for the Texas output.
- The fourth-quarter results, in February: the December quarter against “more than $500 million” and 1.6T against the first order’s December tranche.
6. Risks
The strongest case against this note is the company’s own history. In 2017 it earned $87 million of operating income on $382 million of revenue at a 43.5% gross margin; by 2019 revenue was $191 million and the gross margin 24.2%, Amazon having gone from 35% of revenue to 12% in a single year as its purchases fell away, the 100G node having become a multi-supplier falling-price market, and the margin’s fall attributed in the filing to lower-cost 100G modules and “quality and testing costs” (the FY2019 10-K). The concentration that made that possible is back, two unnamed customers are half of revenue, and the fixed-cost amplifier is now ten times larger. What makes me take the other side is on the documents rather than in the mood: the largest account’s lines are reserved under a paid ten-year contract, the second buyer earns its warrant only by buying, the component the industry is short of is the one this company makes, and the buyers say they want the Texas output; the mechanism that would reproduce 2018, a 1.6T generation turn at Microsoft and Amazon before the company is qualified there, is priced in Exhibit 5 as the standing counter-case at $143, still above the price.
Who is on the other side. Culper Research’s short report of February 2025, on the 800G qualifications, the facilities, the cable book and the dilution; The Razor’s Edge of March 2, 2026, which reads the 800G modules as built on purchased lasers and the margin as an assembler’s, headed for 17% and then 10%, the one published thesis that states this note’s mechanism and assigns it to a competitor; Citrini’s sector report of March 12 on a pluggable basket “priced for perfection” and the rotation to co-packaged optics; Citron’s short call of April 10 on the forward multiple; SemiAnalysis’s report of June 9 on the co-packaged delay; and Martin Shkreli’s short of August 7 on a commodity product in a one-year bottleneck. Short interest was 10.4 million shares at the July 31 settlement, 12.8% of the float, 1.2 days to cover (MarketBeat’s series). The aggregate rating distribution on S&P Capital IQ at August 16 was five targets from $109 to $220 with a mean of $163.40, at “Outperform.”
What I could not establish, and where I looked.
- The second 1.6T qualification. The path’s 2028 assumes it. The receipts are two 800G qualifications, “the fourth supplier qualified” at one buyer, the chief financial officer’s “not for a full qualification at this point” on August 18, and nothing filed; no call has dated it.
- What share of the 800G and 1.6T modules’ lasers is internal today. The filings say “the majority”; the chief executive gave a figure of more than 95% by the end of 2026 on the February call, as the third-party transcripts render it, and conceded purchases before; no product-level split is filed and no counterparty has filed one. The Razor’s Edge’s account rests on former engineers and is dated to March.
- The three long-term agreements, and the customer-funded share of the Microsoft lines. “Around three” in negotiation since at least May, none executed; the statements of work do not say what Microsoft paid for the lines.
- The ladder past 930,000, and the laser line’s first customer. No commissioned 2028 ladder is disclosed; no counterparty names the company for lasers or external laser sources; the first external deliveries are guided for late 2027.
The inputs that carry the value, with their directions. The 2027 and 2028 fill: $218 at 60% and $299 at three-quarters, and the second qualification a year late $248. The margin’s level: $167 at the last cycle’s shape and $268 with the shortage held. The cost of capital: a point on the whole schedule is $203 to $319. The perpetuity’s growth: each half-point is $10 to $21. The laser line: $209 without it, $237 at the sized fifth alone and $290 at twice.
The risks, dated where they have a date.
- A 1.6T generation turn at a large buyer before AAOI is qualified there (thesis 2): the December quarter’s 1.6T below the first order’s tranche, or a fourth slip of the qualification schedule after March, May and August, moves 2028’s volume toward the $248 case and, at a second buyer lost, toward the counter-case.
- The components the company buys gating the ramp for longer (thesis 2): the signal processors and amplifiers on which it is “the fourth priority”; the fourth-quarter guide in November is where a further delay shows.
- The price curve resuming before mid-2027 (thesis 1, thesis 2): the 20% a year Innolight’s 2021 project model budgets for 800G in its first years, applied from the start of 2027, is the $159 case; the makers’ half-year reports in late August and the buyers’ 2027 price negotiations are where it would show first.
- The buyers’ fabrics using fewer optics per accelerator than the four this note carries (thesis 2): the OpenAI and Microsoft design uses two-thirds of the optics of a three-tier fabric at constant bandwidth (the paper, May 5), and Amazon’s flattened design “is now used in AWS data centers and is the default for most new builds globally” (Amazon Science, May 28); the pool a fifth smaller from 2029 is the $184 case and a third smaller the $141 case, and it bears on the years that are this note’s rather than the company’s.
- An allocation shortfall in 2027 forcing equity at a lower price (thesis 2, the count): the correlated form of the last cycle, a capital base built for 930,000 a month under-absorbed and funded at the market; the at-the-market table in each 10-Q is where it shows.
- Charter’s program ending sooner, or Cox not following its vendors (the cable input): the level held from 2028 is worth $257 and the step is already carried; a faster roll-off in Charter’s next annual capital outlook, in January, would take 2027’s $420 million down with it.
- A rule at the FCC that reaches transceivers by producer and slows the buildout the company sells into (thesis 2): the further notice’s reply deadline is September 21; the cost analysis in the order of July 22 itself notes that the transceiver makers it cites are not on the Covered List (FCC 26-50).
- A laser quality failure at a hyperscaler (thesis 1, thesis 3): the 2018 mechanism, not observable in advance; the guarantee and warranty lines in the 10-K are where it would first show.
The view. Long AAOI at $122.19, the August 19, 2026 close, worth $250 a share, 104% above it.
The basis. A data-center margin that settles at 42% in cash terms from 2030 (41% in 2028 and 2029) because the company fabricates the laser its competitors are short of; six million 800G and 1.6T modules shipped in 2027 and nine million in 2028, two-thirds and three-quarters of the published ladder, on a book sold out through the second half of 2027; a laser business from late 2027 at a fifth of a public series; every claim on the equity, including the $600 million the build still needs, in the count; the cash flows discounted at 11% stepping to 9.5%, on a path to 2035 with a perpetuity at 4.5%.
The risks. A 1.6T generation turn at a large buyer before the company is qualified there; the bought components gating the ramp for longer; the price curve resuming before mid-2027; flattened fabrics taking more than a third of the modules per accelerator; an allocation shortfall forcing equity at a lower price; Charter’s program ending sooner; a producer-based rule at the FCC that slows the buildout; a laser quality failure.
The mispricing: the price pays for a module assembler with a thirty per cent margin, a dilution habit and a bad history, filling half of a published ladder with one product line, and it pays nothing for the laser profit where it is largest relative to the price, inside the cost of goods and inside a reserved-line contract. The company makes the part the whole buildout is short of, its ladder fills on its own record, its fab is a second business, and November is the first place that gets scored.