Long: Bloom Energy
Its customers cannot get a heavy-duty turbine running before 2032, and Bloom already owns a second plant.
Disclosure: I am long BE. I may add to or reduce the position without notice and without updating this piece. This is analysis, not investment advice.
The recommendation
Bloom Energy Corporation (NYSE: BE). Long.
| Price | $218.21 | the August 26, 2026 close |
| Value | $358 | +64%, on a second plant the company says it will build and service contracts that pay twice the old rate |
$64.3 billion market cap on 294.5 million shares outstanding, or $71.3 billion on the 326.5 million shares the valuation uses with the convertible notes and the awards counted. The model is attached — every figure in section 3 comes out of it.
Key points. This note rests on three claims; the first depends on the second, and the third stands alone.
Thesis 1: Bloom will build a second plant. It already owns one, at Newark, Delaware, built so that the Fremont production line can be duplicated there. The Fremont plant can take about five gigawatts of annual capacity, a filed sentence about one building, and the company adds a gigawatt of that capacity in six to nine months for $100 to $150 million. Its chief executive has said it “will need new factories as we go forward.”
Thesis 2: Demand for Bloom’s fuel cells will stay strong past 2029, because the gas turbines a data center would otherwise buy cannot be running before 2032. A data center that needs power on its own site has three ways to get it: a grid connection, a gas turbine or engine, or a fuel cell. The first two are queued for years. GE Vernova has sold its production through 2030 and more than half of 2031, Siemens Energy is sold out through its fiscal 2028, and neither will say when the queue clears, so a large turbine ordered today would not be generating power at a data center until 2032 to 2034. A fuel cell costs more to buy than a turbine, but the turbine in that comparison cannot be delivered and running before 2032. Thesis 1 depends on this one: Bloom will only build a second plant if that demand is still there, and if turbines were available in 2029 a second plant would have little to sell.
Thesis 3: The service contracts on Bloom’s new fleet pay about $300,000 per megawatt a year, twice what its old fleet earns. The old fleet, 1.8 gigawatts installed by the end of 2025, earns about $145,000 per megawatt each year. The two contracts on file for the new fleet imply about $300,000, and the company’s own backlog figures, read on gross bookings, land in the same place; the company has never published the rate, so a reader has to derive it from the filings.
The first test has a date on it. The company publishes its backlog once a year, so the February 2027 results are the first reading of the order book since the end of 2025 and the first annual reading of what the new fleet’s service earns. Two dates come sooner: the third-quarter results in late October, the first full quarter at the raised run rate; and the federal decision on Project Jupiter’s gas lateral, due December 3, beside the state’s air-permit hearing, set to open September 14 and stayed by the New Mexico Supreme Court on August 23: the two proceedings on which about two and a half of the six named gigawatts turn. The first hard fact about a second plant, a capital budget, a production rate or a date, can come on any call.
1. Company overview
Bloom makes a power plant that sits on the customer’s own site and turns natural gas into electricity without burning it. The machine is a solid-oxide fuel cell: the gas is reformed inside the cell and reacts across a hot ceramic electrolyte, so there is no flame and no moving part, the smog-forming pollutants a combustion plant emits are near zero, no water is used in normal operation, and the carbon dioxide leaves as a nearly pure stream (the FY2025 10-K, Item 1; the data sheet). The unit is a skid the size of a shipping container that produces 325 kilowatts and is repeated to any size; it makes direct current, and it is installed in weeks to months where a grid connection or a turbine takes years. Bloom sells it with its installation and then runs it for the owner under a service contract of ten to fifteen years, monitoring every unit from two control centres and replacing the fuel-cell stacks as they wear. It is sold in four configurations, from grid-parallel primary power to an off-grid form offered with “the readiness to connect to a utility in the future should the grid become available.” Founded in 2001 and listed in 2018, the company sold to commercial sites and to Korea for two decades, restated its 2018 accounts in 2020 over managed-services agreements it had booked as sales (the FY2019 10-K), and turned to data centers with the orders of 2024 to 2026. It is the only maker of solid-oxide fuel cells at scale: the other fuel-cell makers produce tens of megawatts a year in other chemistries (FuelCell Energy’s 10-Q; Ceres Power’s results), and the turbine and engine makers are its real competitors.
Two product facts carry into the argument. A non-combustion plant is permitted where a turbine is not: the New Mexico regulator’s draft permit for Project Jupiter finds a 2,462-megawatt fuel-cell plant not to be a major source under the federal new-source rules, because its potential to emit stays under the threshold for every regulated pollutant, and the applicant permits the same fuel cells as the campus’s backup fleet, so no diesel generators are needed either (the draft statement of basis, July 29, 2026); California certifies the unit as exempt from district air permits. Its output also follows an AI load’s swings in milliseconds, which rotating machinery cannot do, on the company’s own account.
The customers of the last two years are AI data centers and the utilities and infrastructure investors that serve them, buyers who cannot wait the years a grid connection takes. Oracle signed a master agreement in April for up to 2.8 gigawatts, 1.2 gigawatts of it contracted and deploying; Project Jupiter in New Mexico takes up to 2.45 gigawatts of that in place of the gas turbines and diesel generators first planned. American Electric Power bought “a substantial portion” of a 900-megawatt option outright for about $2.65 billion, unconditionally, for a plant near Cheyenne. Nebius contracted 328 megawatts in New Jersey in three ten-year phases at fees of up to $2.6 billion. Brookfield’s AI infrastructure fund raised its framework with Bloom to $25 billion in June, $2 billion of it committed by mid-year; SK ecoplant has committed to buy 500 megawatts through 2027. Product backlog was “more than $6 billion” at the end of 2025, two and a half times the year before, inside a total of about $20 billion whose service portion runs on contracts of “5 to 20 years, subject to termination for convenience on an annual basis.” At Jupiter the permit’s applicant and the plant’s owner is the campus developer, and Oracle is its tenant; the developer’s permit case of March 2026 was for gas-turbine microgrids with fuel cells as a possible addition by 2029, and the application a month later was fuel cells alone.
In every one of those structures the fee for the power goes to whoever financed the plant. Most end customers prefer to pay for the power they consume rather than own the plant, so the equipment is sold to an infrastructure fund, a project company or a utility, which collects the fee under a power-purchase, capacity or lease agreement with the end customer and takes the 30% investment credit and the project’s risk. Bloom does the developer’s work up to commissioning, is paid once at the sale for the equipment and its installation, and then every year for service at a fee that attaches to every sale; the output and efficiency guarantees it writes are capped at the plant’s purchase price, and its stakes in the financed projects are capped at single digits. That makes it a manufacturer with a service book, which is how the market prices it. What the price turns on is scale: how many gigawatts a year the factory sells, for how long, at what margin.
Capacity is the company’s own decision. The Fremont, California site ran at about one gigawatt a year at the end of 2025, is being doubled to two by the end of 2026 “within our planned budget,” and can take about five gigawatts; Bloom also owns a second plant at Newark, Delaware, built so that the Fremont production line can be duplicated there. The cells are printed at Fremont and assembled at Newark, whose manufacturing floor is about double Fremont’s on the 10-K’s properties table, and the doubling to two gigawatts is being executed inside a capital budget of $57 million in the whole of 2025 and $78 million in the first half of 2026 (the 10-Q). Against that, the installed base at AI customers was about 250 megawatts in August across nearly two dozen customers, and about six gigawatts of fuel-cell nameplate sits at sites with a named customer or a filed permit. The ramp so far is a few deployments for a few buyers: in the second quarter one customer was 73% of revenue.
Revenue was $2.0 billion in 2025, three quarters of it the equipment and a tenth the service of the installed fleet, and the company’s guide for 2026 is $3.9 to 4.2 billion, about double; the lines by year are in the model attached.
2. The argument
Thesis 1: Bloom will build a second plant
The company states the mechanism in its own filings, with a cost and a clock. The FY2025 10-K: the Fremont facility “can accommodate additional capacity expansion of up to approximately 5 gigawatts,” and “each additional incremental 1 gigawatt” takes “approximately six to nine months to install and capital expenditure of approximately $100 million to $150 million.” On the first-quarter call the chief executive said the company had “shifted to adding capacity continuously, hundreds of megawatts a quarter,” and that “today we are not order constrained and not capacity constrained. The pace of our revenue growth is decided by how fast our customers can build their greenfield sites, not how fast we can power them.” Asked on the same call whether there was “a step function” in going beyond five gigawatts, he answered: “no matter what we do, we are going to need new factories as we go forward … So we are going to build factories as needed. And that’s just going to be a normal course of operation for us.” On the second-quarter call: “Capacity is not going to be our constraint as we see right now … the return on investment is going to be a few months, and we’ll keep adding capacity as long as the demand is there.”
The second plant exists. The 10-K describes the Newark, Delaware facility as the company’s first purpose-built plant, “designed specifically for copy-exact duplication as we expand,” with “an additional 25 acres available for factory expansion and/or the co-location of supplier plants,” and both 2026 quarterly reports say the company expects to keep spending capital “to expand production capacity at our manufacturing facilities in Fremont, California and Delmarva, Delaware.” No filing gives that plant a production rate, a capital budget or a date, which is what a company adding capacity as demand appears looks like from the outside while its first site is still filling.
The supplier behind the line is building for it. MTAR Technologies, the Indian hot-box supplier whose managing director names Bloom on its own earnings calls as the customer behind its expansion, and which says it holds and expects to keep a majority share of that customer’s hot-box units, raised its plan three times inside 2026 on the customer’s forecast: in January the customer was “expected to add 2 gigawatts of capacity by the end of CY ‘26 and further scale this to approximately 4 gigawatts in the subsequent years”; in May its management spoke of “multiple capacity expansions required by the customer” whose numbers sat under a signed non-disclosure agreement; by July (the supplier’s own call transcripts, filed with the Indian exchanges) the plan was a three-phase build commissioning by March 2027 on ₹500 crore of capital, with a clean-energy order book of ₹3,431 crore against ₹615 crore of fuel-cell revenue in the year just ended. That is a supplier committing capital to filling the first plant on a forecast that rose within the year; what no supplier statement reaches is a second plant.
The demand is already decided at named sites, and it is larger than the first site. About six gigawatts of fuel-cell nameplate has been filed or contracted at named sites: Project Jupiter’s 2,462 megawatts in New Mexico, in place of the gas turbines and diesel generators first planned; Hedgehog’s 1,500 megawatts in Texas, registered with the state’s environmental agency in December 2025 with “no gas turbines” proposed — a registration the market read seven weeks later, and whose developer’s own announcement in July described a 600-megawatt campus with turbines and named no vendor, so the register and the developer describe two different plants; AEP’s up to 900 megawatts in Wyoming; Volition’s project in Utah, on the state’s register since June and never announced; Nebius’s 328 in New Jersey. The largest and the smallest of the five displaced a queued alternative that had already been proposed, Jupiter’s turbines and diesel and Vineland’s gas engines, and two of the five reached a register before anyone announced them, or instead of it, which is why counts of this market built from announcements run behind the registers. Against those decisions the company had deployed about 250 megawatts at AI customers by August.
So the company’s stated practice is to build the next plant when the first is full, and it owns the site to build it on. The question of a second plant has been asked once on a call, and the answer named no site, no budget and no date, so there is nothing yet to put in a model. Whether the company builds it is the claim this note rests on, and a dated second plant is the fact that settles it.
Thesis 2: Demand for Bloom’s fuel cells will stay strong past 2029, because the gas turbines a data center would otherwise buy cannot be running before 2032
Three routes bought at data-center scale today, two of them queued. The demand this thesis rests on shows itself as dates rather than as a count, because contracted load, permitted nameplate, the makers’ output and Bloom’s shipments are four measures no source converts between, so what can be set side by side is when each route can serve a site. The grid connects on the utilities’ own schedules: AEP Ohio’s 17,861 megawatts of contracted data-center load is served progressively through 2035, with its largest study cohort unservable before late 2031 and 2033, and the utilities have booked contracted load in tens of gigawatts on the same clocks. The turbine and engine makers are sold out: GE Vernova is “largely sold out of ‘30 and more than half of ‘31,” with the heavy-duty units “shipped in ‘30, ‘31, but then really commissioned in ‘32 and ‘33 at site”; Siemens Energy is “sold-out until fiscal year 2028” and will sign past 2030 only once “the broader supply chain and our EPC partners have demonstrated sufficient execution capacity”; Mitsubishi Power’s regional head told S&P Global in July that it is signing contracts for delivery in 2031 to 2034; Caterpillar calls its gas prime power “pretty extended” and its turbines “towards the back half of 2028 and into 2029.” Read as years of output, the three largest turbine makers hold about six, four and five years of their annual production under contract on their own mid-2026 reports (GE Vernova: 116 gigawatts committed against 20 a year; Siemens Energy: 95 against about 24; Mitsubishi Heavy: 80 units against about 16 a year). Two of the makers name construction capacity rather than turbine supply as the binding constraint past 2030: GE Vernova’s customers are “securing the EPC capacity for the early 2030s,” and Siemens Energy conditions signing beyond fiscal 2030 on its EPC partners. The third route is not queued: a fuel-cell factory adds a gigawatt of annual capacity in six to nine months on the maker’s own decision, and the system is at the site in months.
No maker dates a clearing. The makers’ additions arrive in 2028 to 2030, each conditioned on something outside the factory, and are sold through the years they arrive; the one statement from a maker that resembles an oversupply forecast, Mitsubishi’s “we do not expect demand to continue at 100 GW … an average of around 70 GW,” is a raised forecast used to justify a restrained addition.
The comparator is not at the site before 2032, and its cost gap is a fee the vendor sets. On my own arithmetic from the filed inputs — the Energy Server data sheet’s efficiency, the Energy Information Administration’s gas prices and new-plant costs, the two contracts’ service fee, the 30% credit — a fuel cell delivers power at about $106 a megawatt-hour at the site’s bus against $63 for a combined-cycle plant and $73 for an aeroderivative. The fuel legs are within fifty cents; the gap is the service fee, about $36 a megawatt-hour at $300,000 per megawatt-year, larger than the turbine’s entire non-fuel cost. Sized at a maker’s own published overbuild for 99.9% uptime and with the recoverable heat credited, the combustion options land at $80 to 82 and the fuel cell at $95 to 101, a premium of $13 to 21 at the new contracts’ fee and roughly nothing at the old fleet’s. Two cautions travel with that arithmetic. It takes the fuel cell’s efficiency from the data sheet, whose beginning-of-life figure translates to about 58% on the basis the state programmes publish, and the New York programme’s own meter data for the 37 older units it funded, computed on its stated convention, show them starting about a tenth below that and ending three years later a little below the sheet’s floor; if the new fleet runs where the old one ran, the fuel leg is a tenth higher from the first day. A new combined-cycle plant also burns less gas per megawatt-hour than the unit does over its life on the government’s own heat rates; the company’s parity claim is after the grid’s losses, so the fuel legs are level at the site and not at the plant. The gap is the fee either way. And the machine that comparison is made against, ordered in 2029 or 2030, is power at the site in 2032 to 2034: the Canadys combined-cycle plant before South Carolina’s Public Service Commission is 2,180 megawatts at $2,294 per kilowatt for 2033, the applicants’ own estimate, against per-kilowatt costs for this class that have roughly doubled since their 2023 resource plans.
The customers who ran the alternative replaced it. Jupiter’s gas turbines and diesel generators were replaced by fuel cells; Nebius’s New Jersey site was first planned around reciprocating engines, on the city’s planning record; and “80% of the orders that we booked were repeat orders” in 2025. Asked on the first-quarter call whether the hyperscalers see the fuel cell as a bridge to a grid connection, the chief executive said they “used to bring up the concept of bridge power with us, and I would smile and always say, ‘We’re happy to sell you a bridge to a bridge,’ because Superman ain’t coming … Today that conversation is nonexistent.” A bridge cohort exists, and the model fades it. It is not the fleet.
So the demand that the grid and the turbine makers cannot meet in time will persist until the turbines are running, on the makers’ and the utilities’ own dates; the price holds while it does; and a second plant built beside the first one has customers.
Thesis 3: The service contracts on Bloom’s new fleet pay about $300,000 per megawatt a year, twice what its old fleet earns
The company has never stated what the new fleet’s contracts pay. What the filed accounts show is the old fleet’s rate, about $145,000 per megawatt each year, and no service figure is published by line on any surface I can see; the new rate has to be derived.
Two filed contracts imply one. SK ecoplant’s 500 megawatts was “expected to generate approximately $1.5 billion in product revenue and $3 billion of service revenue over 20 years”, which is $300,000 per megawatt-year on average. The 10-K’s disclosure of a 37-megawatt fleet’s repowering records $10.9 million of 2024 service revenue on fees paid “on a fixed dollar per kilowatt basis” — about $294,000 a megawatt-year if that is the fleet’s full-year fee, which the filing does not say. The filed backlog split reads the same way: 2025’s product backlog took about $5.0 billion of gross orders and the service backlog about $4.6 billion, about 1.7 gigawatts and $2.76 million of service per megawatt, which is $221,000 a year at the midpoint of management’s “10-15 years” and about $300,000 once the tax-credit gross-up the backlog definition itself names is taken out of the product side.
The old fleet earns half that. The 1.8 gigawatts deployed by the end of 2025 earned $228 million in 2025 and $131 million in the first half of 2026, $140,000 to 145,000 per megawatt-year for a mixed-age commercial fleet net of guarantee payments. Two fleets, two rates, and the new book’s rate is the one the contracts imply.
The book attaches to every sale. There is “a 100% attach rate between our product sales and our service,” and for the data-center customers “on average, it’s 10-15 years, somewhere in that range,” on terms the filings give as “5 to 20 years, subject to termination for convenience on an annual basis.” The filings give no renewal rate; I did not find one in the FY2025 10-K, the three 2026 results releases or the last four calls. The 2018 prospectus described the right itself: customers may renew “on an annual basis, for up to 20 years, at prices predetermined at the time of purchase of the Energy Server,” which puts the price on the company’s side and the option on the customer’s. The annual termination right is real and I price it in section 3 as the market reads it; it is a duration risk on a stream whose rate is filed.
So the new fleet’s service earns about twice the old fleet’s rate, and on this note’s model the difference between the old fleet’s rate and the contracts’ is about $48 a share. The FY2026 10-K’s service line is where the new fleet’s rate first becomes observable.
3. Valuation
A discounted-cash-flow model on one operating path, explicit to 2035 with a transition to 2045 and a perpetuity after it. The workbook carries every line; the pictures and the tables in this section come out of it.
Exhibit 1. The model’s accounts by year, from the workbook’s financial summary sheet: revenue by the company’s own lines, the margins, operating profit, EBITDA, earnings per share and free cash flow, 2023 to 2035. The shaded cells are the editable inputs.
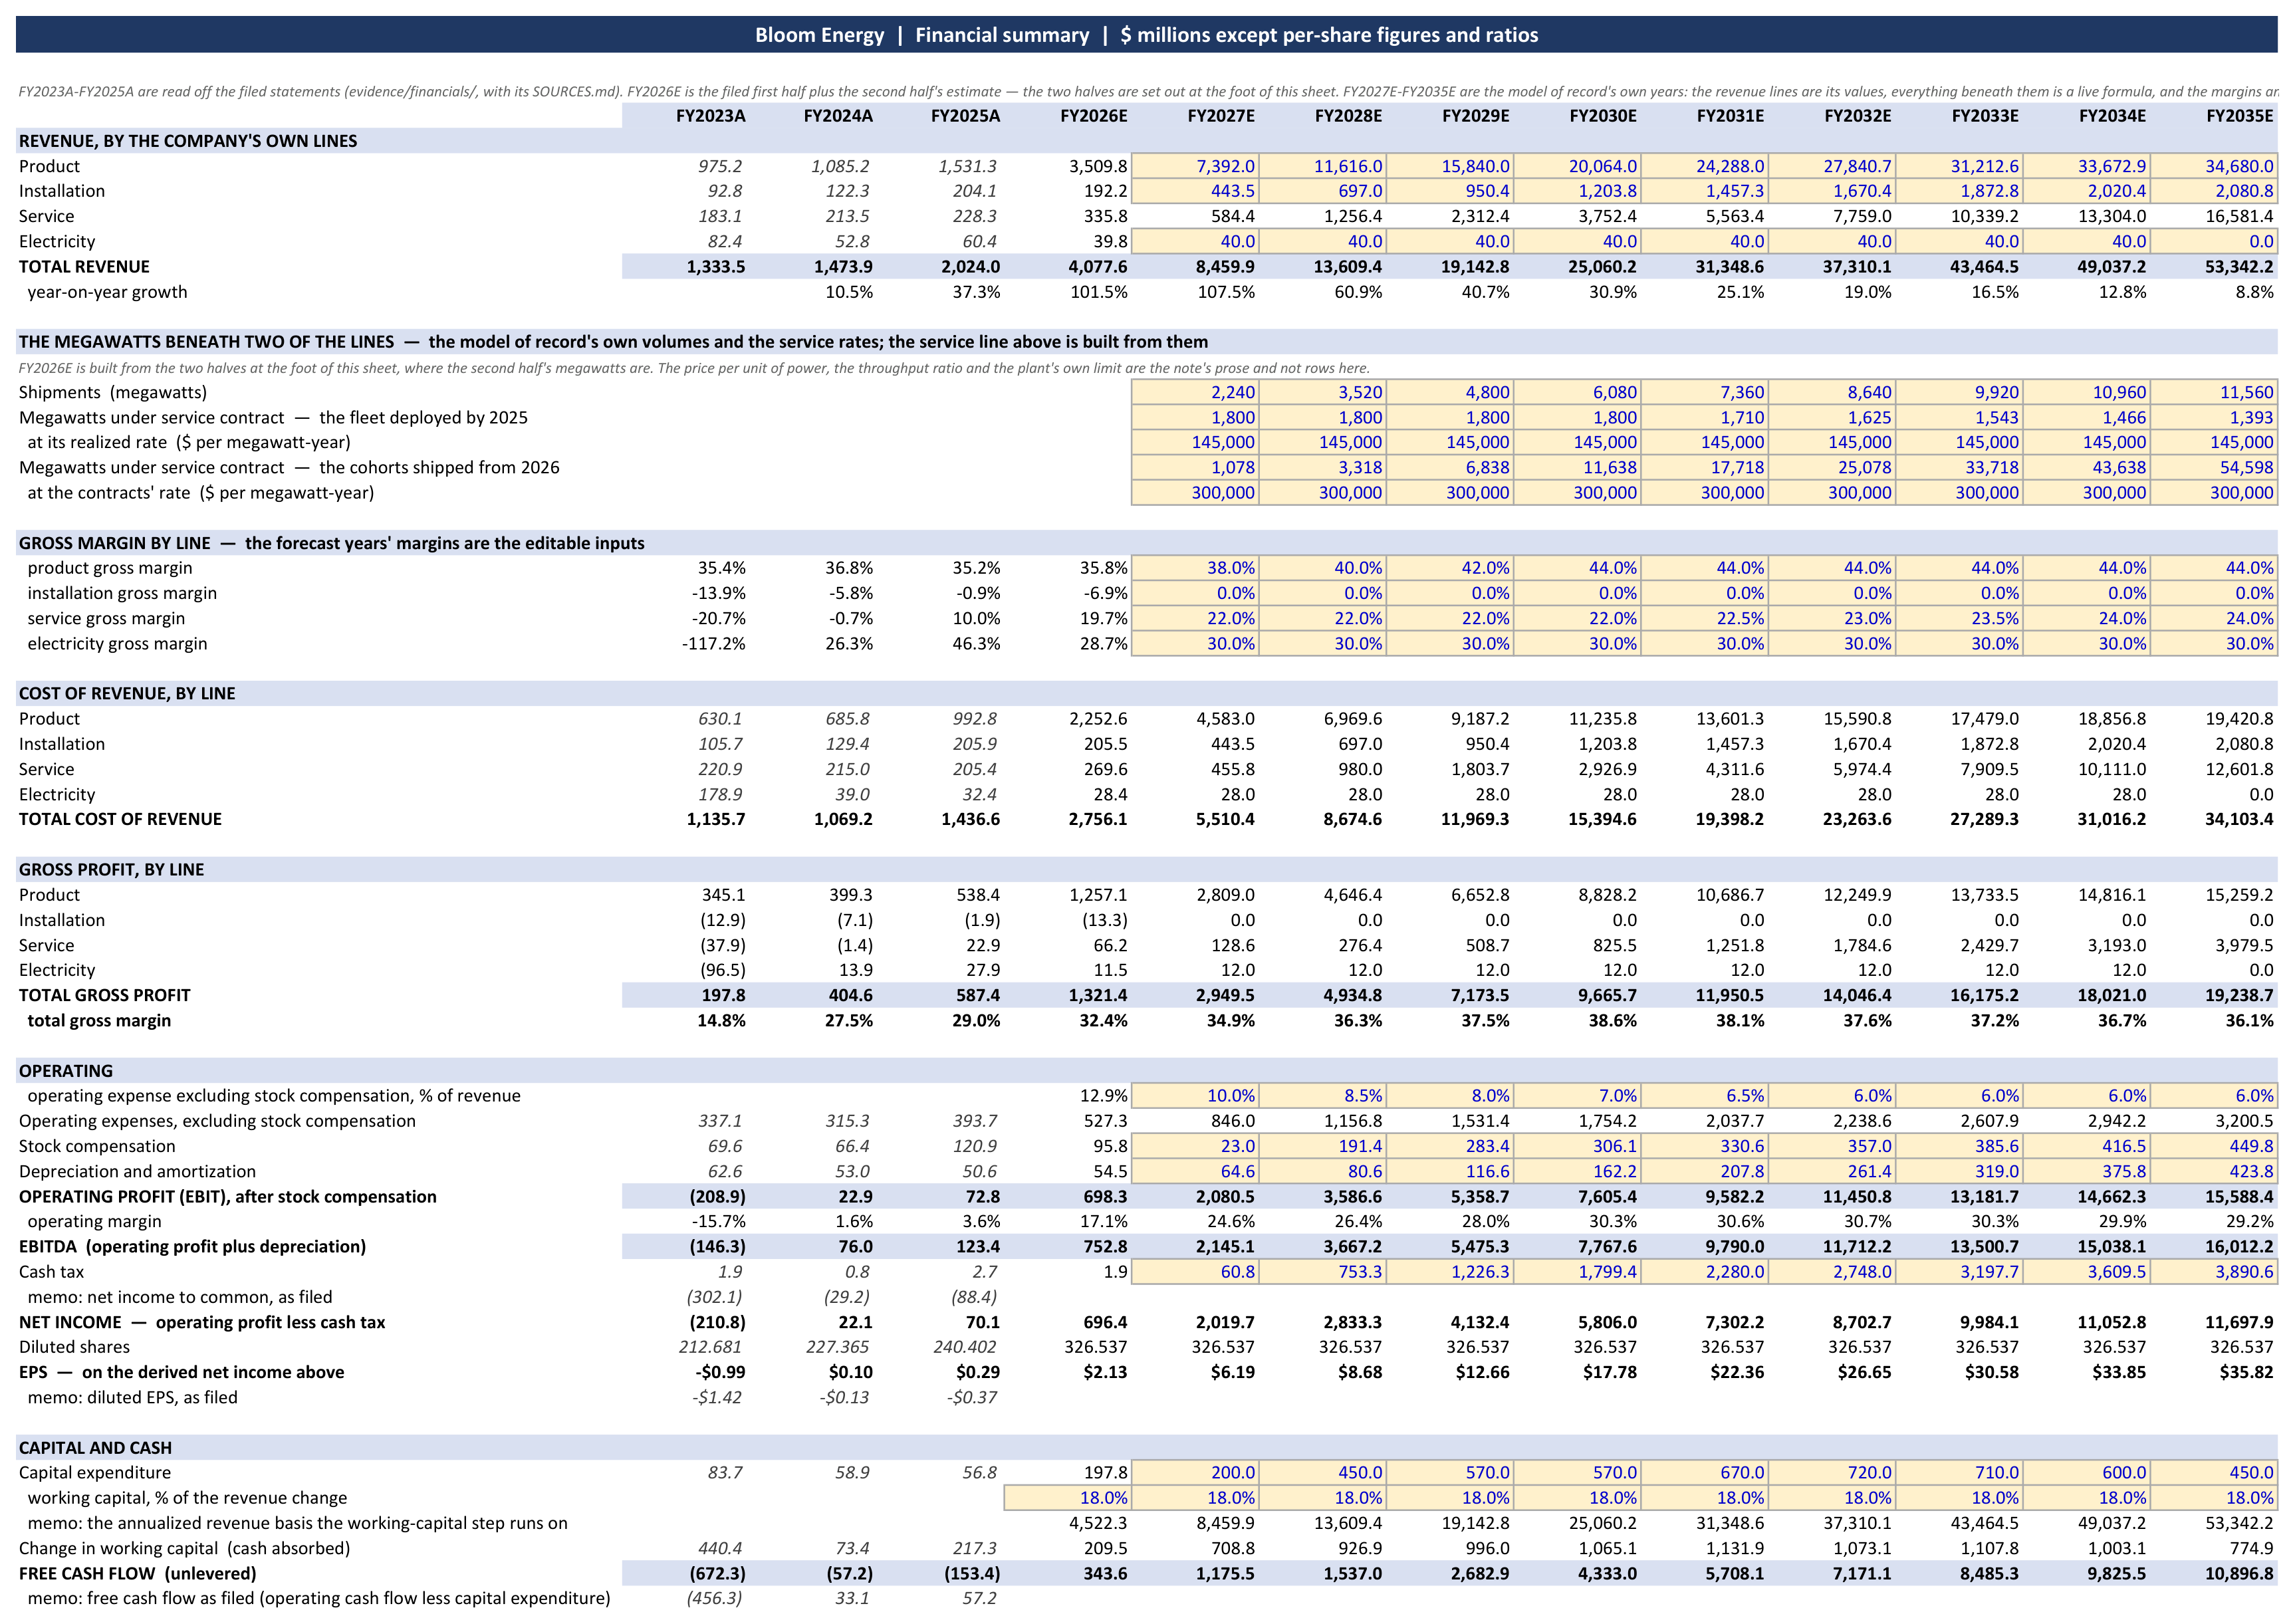
Source: the model attached, Financials sheet; 2023 to 2025 as filed.
What sets the key values in the sheet, line by line.
Through 2026 the company’s own guide sets the numbers. Second-half revenue is the raised guide’s midpoint at the second quarter’s product share, 582 megawatts at $3,300 per kilowatt, product margin at the certified 36%.
From 2027 the volume is the company’s own capacity mechanism run as a rule, at the middle of its stated pace. Capacity of two gigawatts at the end of 2026, then 1.6 gigawatts a year added through 2033, the middle of “six to nine months” per gigawatt, and 1.0 and 0.5 gigawatts in 2034 and 2035 as the turbine makers’ deliveries arrive at the sites and narrow the demand left for new orders; shipments at 80% of each year’s average capacity, the utilization 2026 itself is running at, because “the pace of our revenue growth is decided by how fast our customers can build.” That gives 2.2 gigawatts in 2027, 3.5 in 2028, 4.8 in 2029, 6.1 in 2030, 7.4 in 2031, 9.9 in 2033 and 11.6 in 2035, the Fremont site passed at the end of 2028 and a second plant continuing from it at the same pace. The pace is the middle of the band rather than its top because the demand arithmetic, 30 to 40 gigawatts of data-center additions in 2027, a third of it on site, a quarter of that fuel cells, supports nothing materially above six gigawatts in 2030 — the chief executive’s 30 to 40 gigawatts and my reading of the sector’s shares, not a published count. The capital for the capacity beyond Fremont is $200 million a gigawatt, the greenfield rate Fremont cost in 2022, charged the year before it ships.
The price holds at $3,300 per kilowatt through 2031 and tapers to $3,000 by 2035. The level sits above the two filed floors, the $2,944 per kilowatt that AEP’s $2.65 billion would mean for the whole 900-megawatt option and the $3,000 SK ecoplant’s 500 megawatts implies, because the company says its customers “are paying for time to power” rather than for the kilowatt; the filings quantify no price above the floor, so the $300 above it is a judgment, and at $3,000 throughout the value is $353. The taper is the premium for delivery fading as the alternatives start running at the sites in 2032 to 2034. I hold the price until the alternatives are running, not until they can be ordered; fading it from 2028 instead is worth $3 a share.
Product margin rises two points a year to 44% by 2030 and holds. That is about the pace of the last five years — the company’s non-GAAP gross margin went from 22% in 2021 to 30% in 2025 on its own slides — on a platform the company says “has allowed the Company to reduce costs by double digits every year,” in a market where the customer is paying for time rather than for the kilowatt; 44% is the cap because no filed cost path runs beyond it.
Service earns $300,000 per megawatt-year on every megawatt shipped from 2026, from the year after shipment, at a 22% margin rising to 24% by 2034; the old fleet earns its realized $145,000 and retires 5% a year from 2031. Operating expenses fall from 13% of revenue in 2026 to 6% by 2032: the cost base grows with the organization rather than with shipments, so the ratio falls as revenue rises sixfold, and I hold it at 6% rather than let it keep falling. Working capital absorbs 18% of each year’s revenue change, the rate the first half of 2026 built at before the $282 million of customer deposits that made the half a source of cash; the deposits are not credited. Stock compensation is charged in full from 2029, and in 2026 to 2028 net of the $401 million of unrecognized expense on awards already counted in the share count. Tax is 21% federal and 4% state with the carryforwards used at the 80% limit.
Exhibit 2. The discounting, from the workbook’s valuation sheet: the cash flows of the second half of 2026 to 2035 at the rate schedule, the transition to 2045, the perpetuity, and the value.
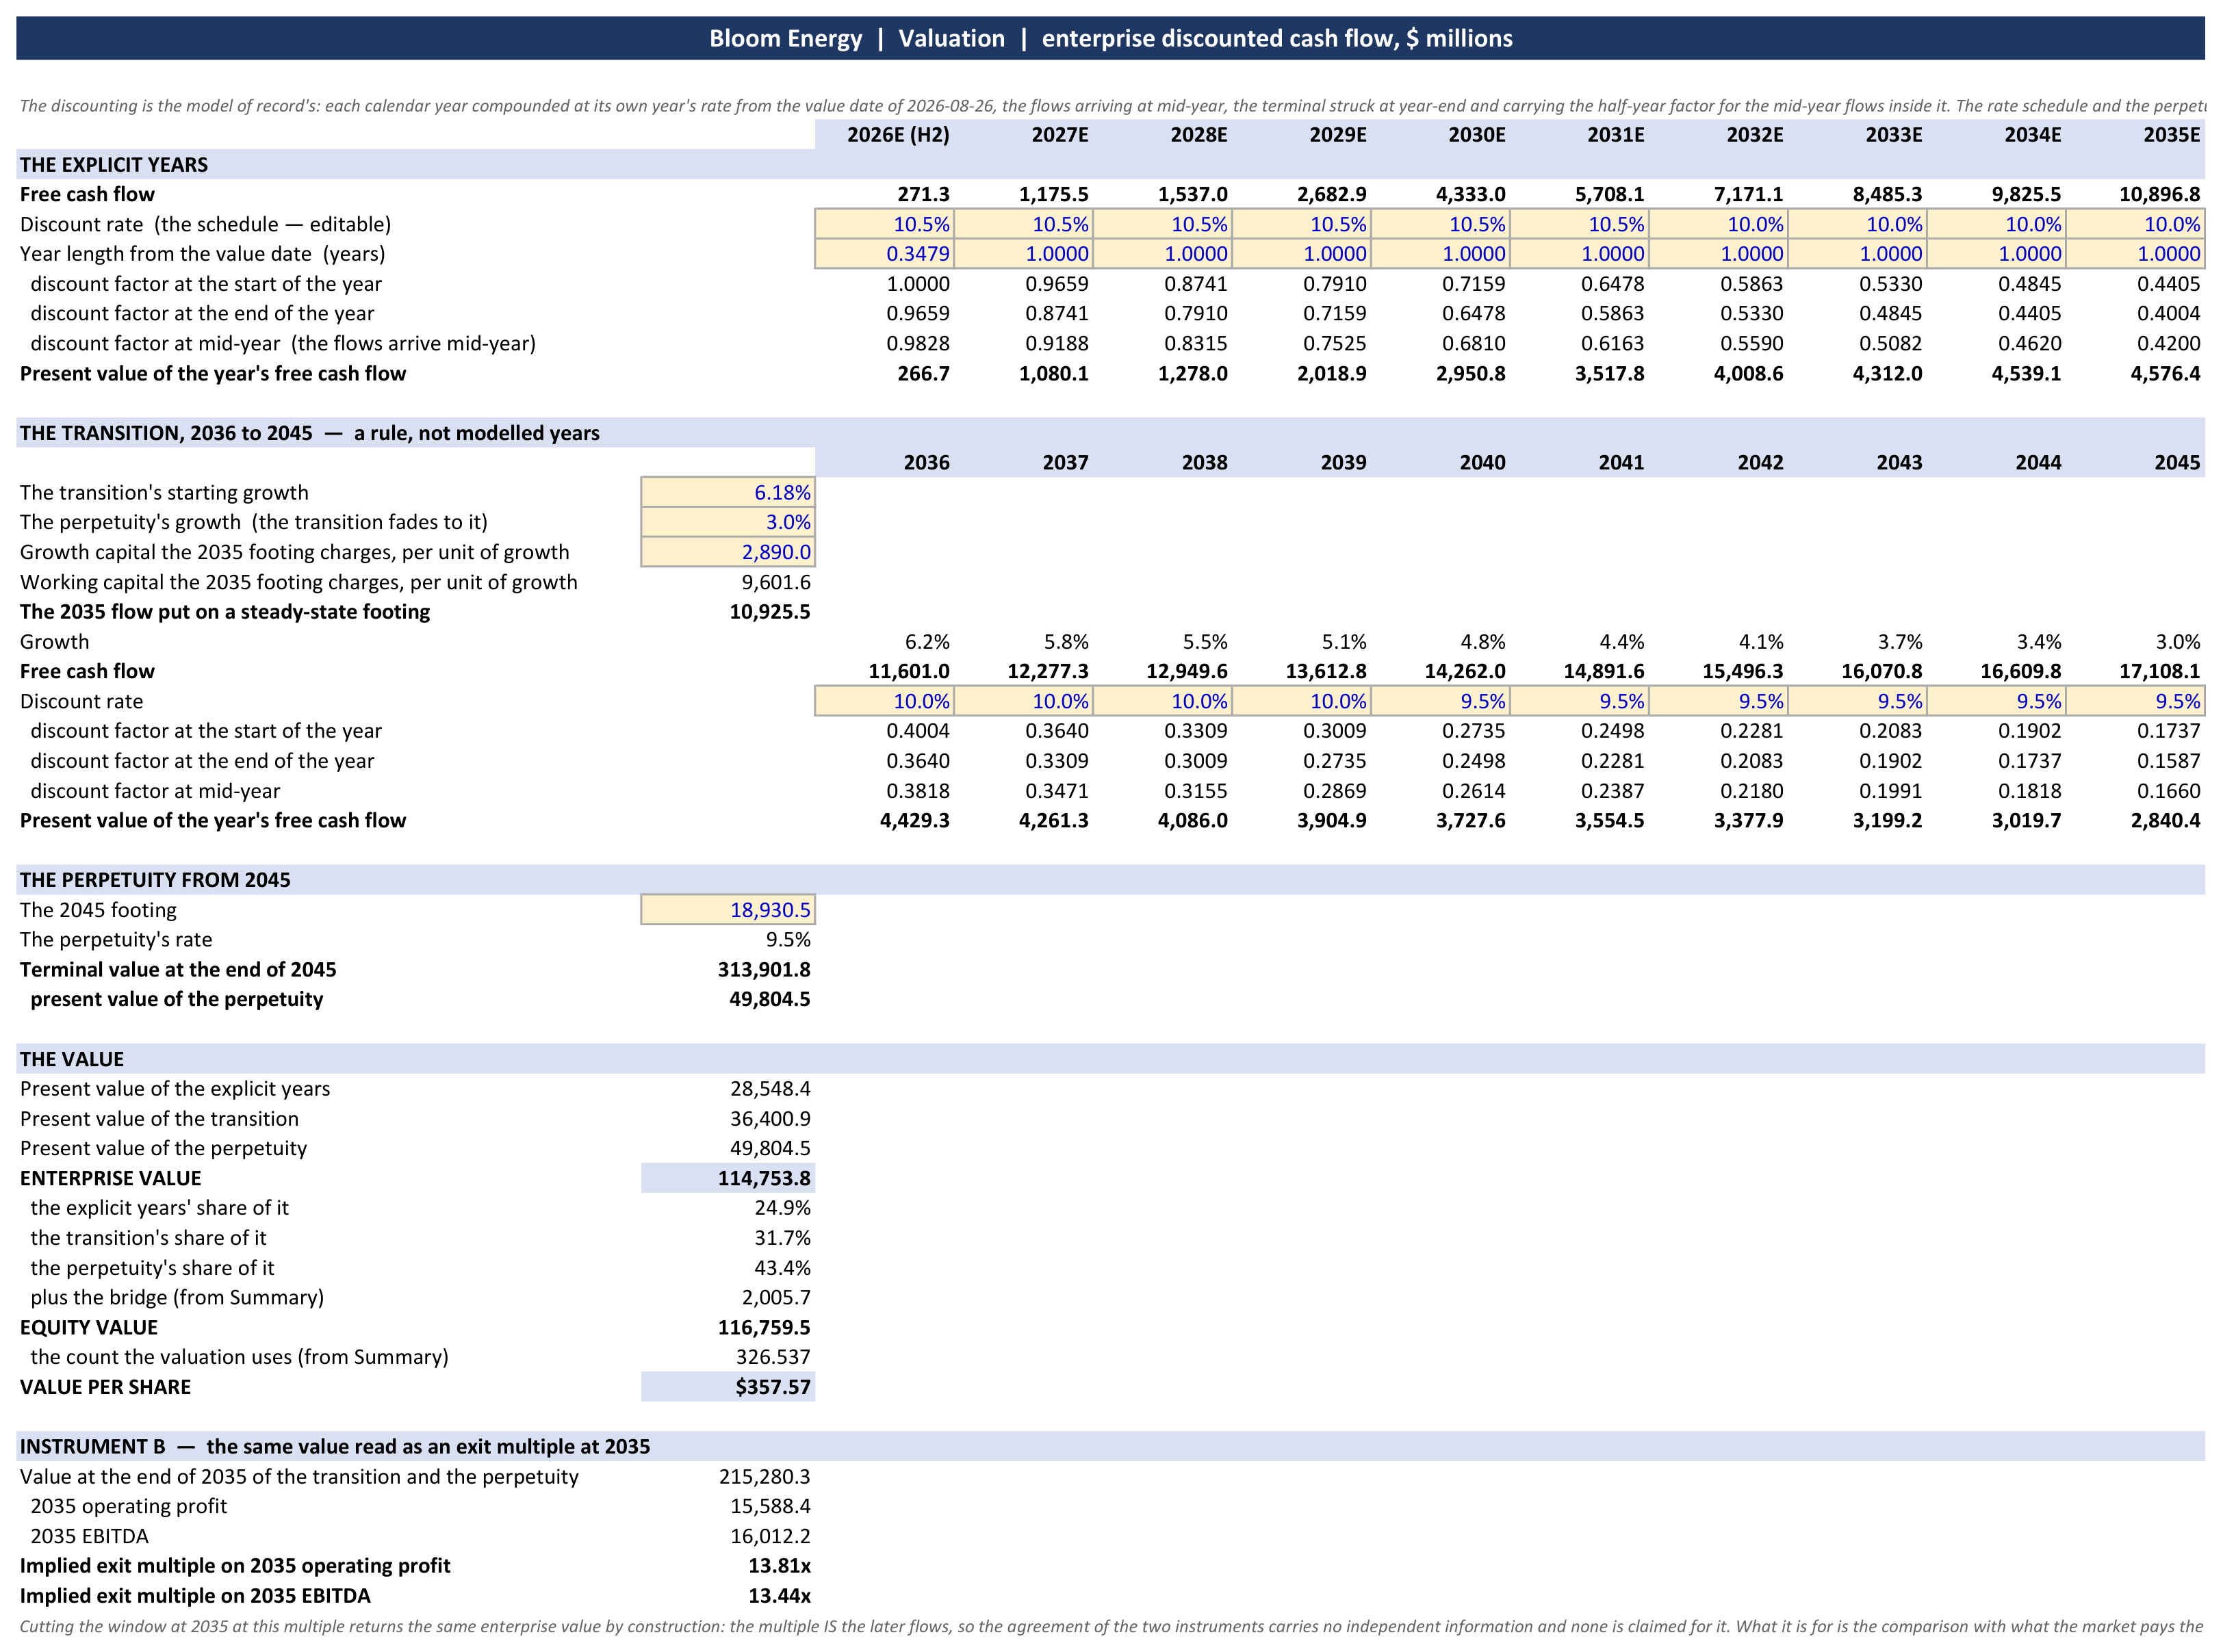
Source: the model attached, Valuation sheet.
What sets the discounting and the horizon.
The cost of capital is a schedule from the company’s own instruments: 10.5% through 2031, 10.0% through 2039, 9.5% after and for the perpetuity. The company’s own collateralized term rates, the ones it discounts its leases at, are 10.5% on operating leases and 9.0% on finance leases against a risk-free rate of about 4.7%. The schedule starts at the top of that band while the makers are sold out and the second plant is built, and steps down as the contracted annuity becomes the larger half of the business. A point on the whole schedule is worth about $59 to 81 a share, and the grid below shows it.
The horizon is ten years, then a rule. 2035 is the last dated event the model rests on: the alternatives running, the tax credit phased down, the second plant built and filled. From 2036 the cash flow grows at a rate fading from the model’s own continuation (6.2%, the service book filling behind the ramp) to 3% by 2045, and a perpetuity at 3% and 9.5% is struck on the 2045 flow. That form implies an exit at 13.8 times 2035 operating profit, 13.4 times EBITDA, against about 29 times this note’s own 2027 EBITDA at today’s price. The perpetuity is 43% of the enterprise value and the transition 32%; the years I model line by line are a quarter of it.
The output: $114.8 billion of enterprise value, $116.8 billion of equity after $2.7 billion of cash and the deposits already received, $358 a share on 326.5 million shares. Revenue runs $8.5 billion in 2027, $25.1 billion in 2030 and $53.3 billion in 2035; operating margin 30% in 2030 and 29% in 2035, the second lower because the price tapers while the margin holds; service is 15% of revenue in 2030 and 31% in 2035, on its way to half. The enterprise value is 14.8 times this note’s 2030 EBITDA. Exhibit 3 carries the bridge from the enterprise value to the equity and the count.
Exhibit 3. From the enterprise value to the value a share, from the workbook’s summary sheet: the bridge at the June 30 balance sheet and the count the valuation uses.
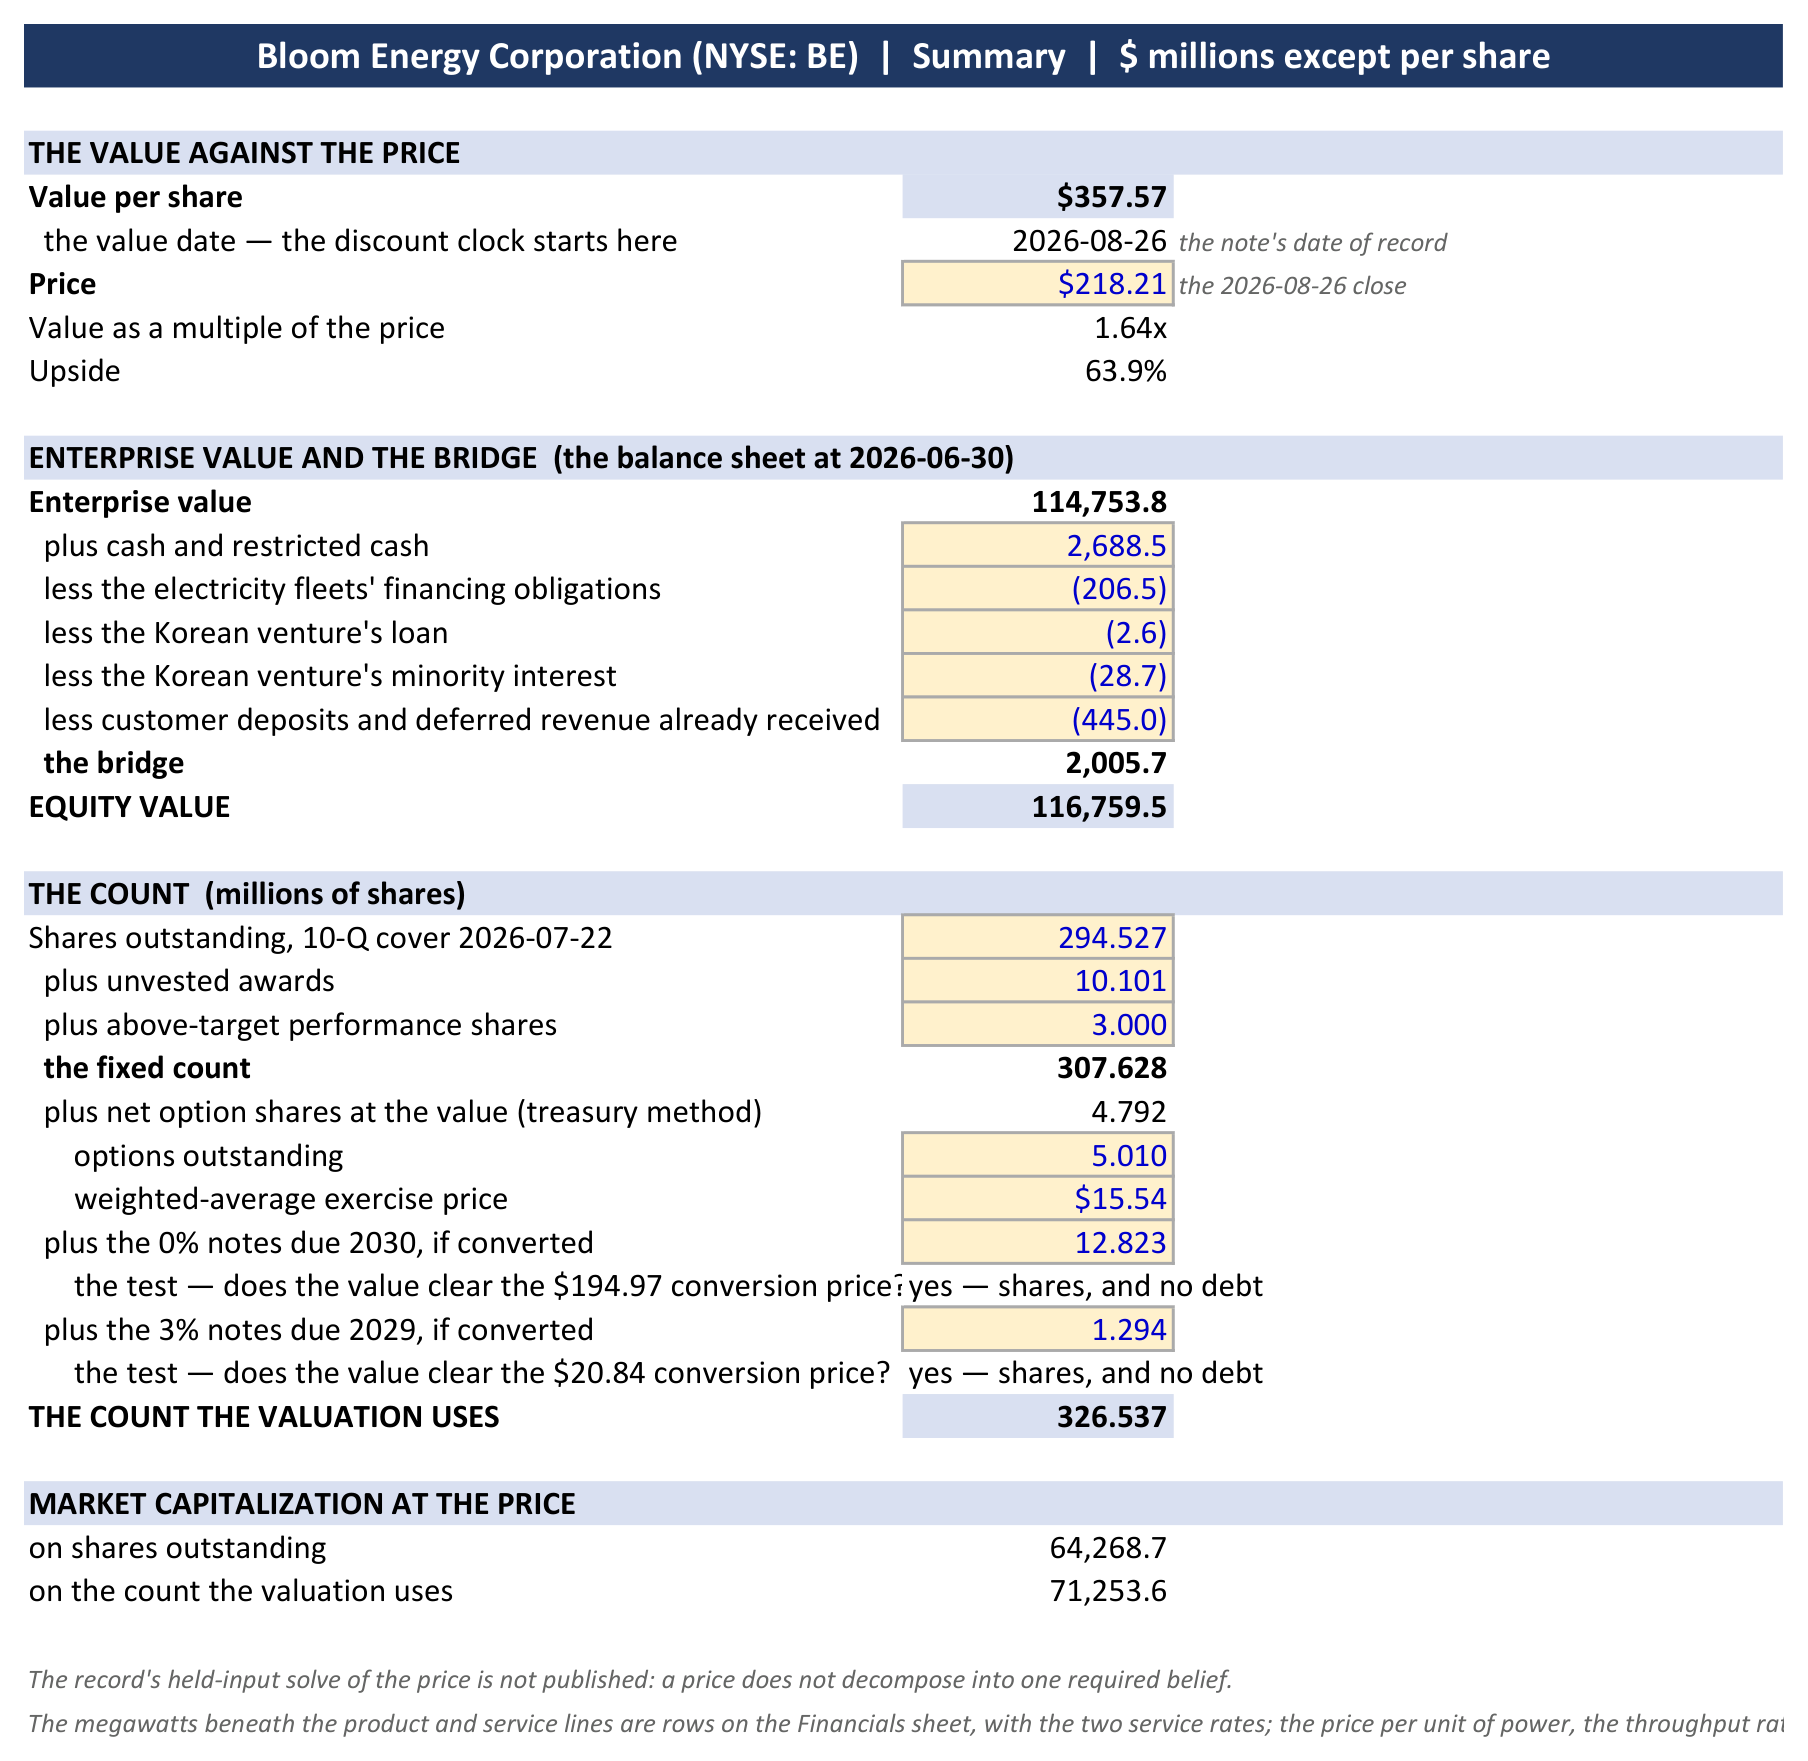
Source: the model attached, Summary sheet.
Where the value would be wrong, and by how much. The scenarios are readings I refused and priced; Exhibit 4 gives each with what it requires and the value the model gives.
Exhibit 4. The cases, what each requires, and the value a share.
| The case | What it requires | Value |
|---|---|---|
| The first factory filled and nothing past it | 5 gigawatts a year from 2029, growing with the fleet after | $185 |
| The same, at the site’s own capacity and utilization | 4 gigawatts a year from 2029, no growth | $121 |
| One plant, valued generously | the first site filled; 44% margins; 7% operating expense; 25% working capital; a point lower cost of capital; 4% perpetual growth | $251–260 |
| The second plant one year late | 2029 held at the site’s five gigawatts, the additions resuming in 2030 | $316 |
| The additions at the low end of the stated pace | 1.3 gigawatts a year rather than 1.6 | $302 |
| The price fading on the makers’ order calendar for the whole book | 2% a year from 2028 | $343 |
| Service at the old fleet’s rate | $145,000 per megawatt-year on the new book | $310 |
| The new fleet’s contracts ending at six years, none renewed | the annual termination right exercised at the first term | $319 |
| This note’s path | as above | $358 |
| The additions at the top of the stated pace | 2 gigawatts a year | $431 |
| The alternative arrives in 2029 | volume held at 4 gigawatts; the price down 5% a year to 2035; margin to 25% | $68 |
Source: the model attached, Scenarios sheet.
The bottom row is three inputs moved together on one event the makers date later, and it is what the position looks like if the turbine makers are wrong about their own order books. The top of the table is the one-plant view: the first site filled and nothing past it is worth a sixth to almost half less than today’s price, and valued generously, with margins, cost ratios, cost of capital and terminal growth each set more favorably than I set them, one plant lands about a sixth above it, so the price sits between the first site filled and the first site valued generously. The gap between the one-plant view and $358 is the second plant and the service contracts, and nothing else. A reader who takes those generous inputs on my volume arrives at about $510; I do not claim it.
The sensitivity. Exhibit 5 moves the whole cost-of-capital schedule against the pace of the additions: the low end of the company’s stated pace, the middle this note uses, the top, and the first site alone with nothing past it. The workbook’s sensitivity sheet carries a second grid, the schedule against the perpetuity’s growth, and on it every cell in the row I use clears today’s price; a point higher on the whole schedule with 2% perpetual growth is $285.
Exhibit 5. The cost-of-capital schedule shifted in parallel, against the pace of the additions; value a share.
| The schedule | low end | middle | top | first site only |
|---|---|---|---|---|
| two points lower (8.5% → 7.5%) | $471 | $559 | $677 | $276 |
| a point lower (9.5% → 8.5%) | $370 | $439 | $531 | $223 |
| as modelled (10.5% → 9.5%) | $302 | $358 | $431 | $185 |
| a point higher (11.5% → 10.5%) | $253 | $299 | $360 | $158 |
| two points higher (12.5% → 11.5%) | $216 | $255 | $306 | $136 |
Source: the model attached, Sensitivity sheet.
The first site alone clears the price only with the whole schedule a point or more lower; the distance from $185 to $358 at the schedule is the second plant and the service book.
What I am not claiming. The model’s own rules run on to 2055, with the service book filling and retiring systems re-bought, give about $396; the same volume with every other input at the most favorable end of its evidence gives $413. Both are above my number and neither is my claim. The claim is a second plant at the middle of the company’s own stated pace, on margins, cost ratios and a cost of capital I have not set generously.
4. Management and incentives
The chief executive is paid on the two quantities this note rests on. His 2026 award pays up to 300% of target on the highest four consecutive quarters of revenue between July 2026 and the end of 2029, adjusted up or down by the 2029 non-GAAP product gross margin: volume and margin, through the year the second plant would be filling, and nothing on cash or on the share price. The 2025 award paid at 300%. The incentive is to ship, at margin, for three more years.
Management sold into the run and has bought nothing. Insiders sold about 678,000 shares for about $139 million in 2026, the chief executive 200,000 of them at $170 in February; there were no open-market purchases and there is no buyback. Oracle was paid for its partnership in stock: a warrant on 3.53 million shares at $113.28, net-settled in May for about 2.15 million shares, which are in the count above and whose value the accounting amortizes against the revenue those deployments bring.
The disclosure is contracting exactly where the multi-year case is made. The chief financial officer said in February 2025 that “a simple proxy of ASP or cost per kilowatt is a less relevant way to look at the business than it was a few years ago,” and in April that “we stopped talking about megawatts shipped in specific periods”; backlog is given “once a year. That is our policy”; and in July 2026 the deck lost its cash-flow metrics — “the free cash flow guide was pulled,” as an analyst put it on the call; metrics that “are not formal guidance,” as the chief financial officer answered, giving “$375 million plus” of operating cash flow “as being our new baseline.” A reader can no longer size the second plant, the service book or the price from what the company publishes between annual reports. That cuts both ways: it is why the models stop at the site, and why the February 10-K matters more than any quarter in between.
The capital structure has been rebuilt around the equity. The November 2025 exchange of the 3% green notes issued 42.4 million shares, and the $2.5 billion of 0% notes sold the same day carry no coupon because the conversion right at $194.97 was sold with them. A new chief financial officer was appointed in March 2026.
5. Risks
The strongest case against this note is that the second plant is an asset, not a decision. No filing dates, sizes or funds a programme past Fremont. If the company never builds one, the volume is the first site’s and the shares are worth $150 to 185, a sixth to a third below today’s price, and the models have it right. What makes me take the other side is the company’s stated conduct (“factories as needed … a normal course of operation”), the plant it already owns and is spending capital at, its supplier’s committed build on a forecast that rose three times in a year, and demand that the turbine makers’ own dates say will persist; an undated second site while the first is not yet full is what that conduct predicts, not evidence against it.
Who is on the other side. The two short campaigns of July, Hunterbrook’s on scandium and then on field output and stack life, and Crossroads Capital’s on scandium; and Situational Awareness, the fund for which Bloom was the largest position at year-end on its own 13F filings, which cut it from 10.1 million shares to 6.5 million in the first quarter and held there through June. The stock fell by half in five weeks this summer, from $346 to $164 on closing prices, through the two scandium reports and a quarter’s print; Hunterbrook’s field-output report came the day after the low, and the shares have since risen about a third.
What I could not establish, and where I looked.
- Scandium. Hunterbrook puts the scandium oxide sealed into each megawatt at about 25 kilograms and the supply Bloom would need at five gigawatts a year at 220 tonnes, against a projected 240 for 2030; Crossroads Capital puts the loading at about 75 kilograms of oxide a megawatt and the supply at enough for about two gigawatts a year. The company’s 8-K of July 9 states “clear visibility into our supply chain to support production of 25GW of fuel cells per year.” The electrolyte’s scandia fraction is about ten mol per cent in the company’s patents of 2007, 2010 and 2021 priority, unchanged; the thickness spans twenty-fold across their architectures, the thinnest in a 2022 application still pending, and no document says which ships; the cell’s area, the cells per stack and the stacks per megawatt are stated by no primary, so every loading figure in circulation, 75, 60, 44 or 2 to 9 tonnes a gigawatt, supplies the geometry itself. The company’s own statement that “several hundred tons” a year can be recovered from titanium waste streams (its blog of July 8) is about what can be produced, not what is. The USGS puts 2025 world production at about 80 tonnes against 60 consumed, with the price falling every year since 2021, across five years in which Bloom’s product revenue more than doubled. A securities class action on the sourcing disclosure was filed at the end of July. I carry the shorts’ case as the margin path it would produce, $212 a share at a 25% product margin, and the ceiling as a volume case, and I cannot resolve it from any filing.
- The new fleet’s realized service rate. Two contracts and a backlog split say about $300,000; the old fleet earns half; no filing states what the data-center customers of 2029 will pay, or for how many years. The February 10-K is the first place this becomes observable.
- Stack life and replacement. The company’s data sheet is itself a degradation curve, 65% electrical efficiency at the start of life falling to 53% over the project term, and the company keeps a fleet where it wants in that band by replacing modules at an interval it has never published; its one quantified statement is that stack life is up two and a half times since the first generation. The guarantees it writes on output and efficiency are capped at the plant’s purchase price; the cap rose from $585 million to $846 million in the first half of 2026, almost all of it new contracts, while payments ran near $18 million a year and the company attributed their rise to “the effects of fleet degradation.” The New York programme’s meter data for its 37 older units, computed on the programme’s stated basis, start about a tenth below the sheet’s beginning-of-life figure and end three years later a little below its floor, with an ordinary fall in between; Hunterbrook’s second report reads the California fleet the same way, but its figures and the company’s are quoted on two heating-value bases nobody has stated, some six points apart. The current generation is in no public series. The service margin’s rise from a loss of a fifth in 2023 to 19% in the second quarter of 2026 is, in the company’s own decomposition, fewer field replacement units and more contract revenue against an ageing fleet’s rising repair and guarantee costs, and it coincides with a two-year programme of buying back and repowering the oldest fleet (the 10-K, the repowering note), which is why the service margin in section 3 carries half the scale effect management claims.
The inputs that carry the value, with their directions. The volume from 2029: the whole valuation turns on it, and none of the counterparty filings I read dates a fuel-cell service in 2029 or after, on either side of the argument. The cost of capital: a point on the schedule is $59 to 81 a share. The service rate: $145,000 to $375,000 spans $310 to $381. The price’s clock: the taper on the order calendar rather than the delivery calendar is $3.
The risks, dated where they have a date.
- A second plant never dated. No filing has given the Delaware plant or another site a capital figure, a run rate or a date; if none does through the FY2027 results, the volume is the first site’s and thesis 1 fails, and a second site dated at a materially lower pace than the stated band moves the value toward $302.
- The turbines arriving sooner. A maker naming the year its queue clears, GE Vernova’s 2032 becoming contractable, Siemens signing past fiscal 2030, or the utilities’ contracted-load series turning down takes thesis 2’s demand past 2029 with it: the price hold first, and a year later the second plant’s customers.
- The service rate at the old level. The FY2026 10-K’s service line implying a rate on the new fleet at or below $221,000 per megawatt-year removes thesis 3 on its own, about $48 a share, without touching the other two.
- The customers’ sites slipping. Jupiter lost, Vineland stalled, the utilities’ own dates preferred, for two years running: not the end of thesis 1 but a later second plant, and each year of delay is worth about $40 a share.
- The new fleet’s efficiency running where the old fleet’s ran. The New York units started about a tenth below the data sheet’s beginning-of-life figure; if the 2026 fleet does the same, the fuel leg of the customer’s cost is a tenth higher from the first day, the premium over a turbine in thesis 2 wider than computed, and the service margin’s cases in section 3 sit lower. The FY2026 10-K’s guarantee and service lines, and any public field series on the current generation, are where it shows.
The view. Long Bloom Energy at $218.21, the August 26, 2026 close, worth $358 a share, 64% above it.
The basis. A second plant built at the middle of the company’s stated pace and filled by customers the grid and the sold-out turbine makers cannot serve before 2032, and service contracts on the new fleet at the $300,000 per megawatt-year the two filed contracts imply; the cash flows discounted at the company’s own rates, 10.5% stepping down to 9.5%, on a path modelled to 2035 with a perpetuity after 2045.
The risks. No dated second plant through the FY2027 results; a turbine maker dating the year its queue clears, or a turbine ordered today running inside three years; the February 10-K’s service line implying a rate on the new fleet at or below $221,000 per megawatt-year; the new fleet’s efficiency running where the old fleet’s ran, a tenth below the data sheet.
The mispricing: the price pays for one factory: it sits between that factory filled and that factory valued generously. The company adds a gigawatt of capacity in six to nine months, says it will build factories “as needed,” already owns the second site, and sells to customers the grid and the sold-out turbine makers cannot serve for years. The second plant and the service contracts are the gap, and February is the first place it gets scored.